Welcome to our final lesson in this module on experimental design. In our previous sessions, you've mastered how to compare multiple lingerie styles using one-way ANOVA and how to pinpoint specific differences with Tukey's HSD post-hoc tests. This is powerful, but it's limited to analyzing one factor at a time, like "bottom style."
In reality, the appeal of a complete look is rarely about a single garment in isolation. It's often about the harmony—or lack thereof—between pieces. For instance, is a plunge bra equally effective with a thong as it is with a high-waist brief? Or does the success of the bra style depend on the bottom style it's paired with? This lesson introduces two-way ANOVA, a technique that allows you to investigate precisely this kind of question. We'll explore how to analyze the impact of two factors simultaneously and, most importantly, test for the presence of an interaction effect between them.
From One Factor to Two: Main Effects and Interactions
A one-way ANOVA tests one hypothesis: whether the means of several groups defined by a single factor are different. A two-way ANOVA expands this to test three distinct hypotheses about your data:
- Main Effect of Factor A: Does the first factor have an effect on the outcome, averaged across all levels of the second factor? (e.g., "Overall, is there a difference in appeal between plunge and balconette bras, regardless of the bottom style?")
- Main Effect of Factor B: Does the second factor have an effect on the outcome, averaged across all levels of the first factor? (e.g., "Overall, is there a difference in appeal between thongs and high-waist briefs, regardless of the bra style?")
- Interaction Effect (A x B): Does the effect of one factor depend on the level of the other factor? (e.g., "Is the difference in appeal between a thong and a high-waist brief different for a plunge bra compared to a balconette bra?")
This final question about the interaction is often the most insightful one in a design context. As you know from your statistical background, two-way ANOVA partitions the total variance in your outcome variable (e.g., 'look rating') into components attributable to each main effect, their interaction, and the residual (or unexplained) variance.
Interpreting results: Two-way ANOVA - GraphPad
This article from GraphPad provides a concise summary of how two-way ANOVA breaks down the sources of variation.
Please read the sections Source of variation and ANOVA table. This will refresh your memory on how the total variability is partitioned among the main effects, the interaction, and the residual error.
The Crucial Concept: What is an Interaction?
An interaction effect is present when the answer to "Which style is better?" is "It depends." This is a fundamental concept in experimental design and is likely something you've intuitively navigated in your own design work. Two-way ANOVA gives you the statistical tool to formally test for it.
For your lingerie project, a significant interaction between bra_style and bottom_style would mean you can't make a simple recommendation like "Plunge bras are always better." Instead, the optimal recommendation would be conditional, for example: "Plunge bras are superior when paired with thongs, but balconette bras are better when paired with high-waist briefs."
Visualizing the group means is the best way to understand an interaction. The following videos provide excellent conceptual and visual explanations.
ANOVA Part 2: Dealing with Intersectional Groups: Crash Course Statistics #34
This Crash Course Statistics video gives a great real-world example of interactions and how to spot them.
Watch from the discussion on car prices to the end of the interaction plot explanation, covering these key segments: An introduction to the concept of interaction. An applied example using olive oil tasters and bottle types, which sets up a two-way ANOVA with an interaction term. A clear explanation of how to read an interaction plot. Notice the key visual cue: parallel lines suggest no interaction, while non-parallel lines suggest an interaction.
Now, let's look at a few more graphical examples to solidify this idea.
Lecture 7.2 Understanding Interaction Effects
This video focuses specifically on using graphs to identify different patterns of main effects and interactions.
Watch the four examples presented in these segments: No interaction: Notice how the lines are parallel. The effect of one factor is consistent across the levels of the other. Still no interaction: The lines are sloped, indicating two main effects, but they remain parallel. An "alligator jaws" interaction: The lines are not parallel. The effect of posture is different for the two keyboards. A "crossover" interaction: The lines cross, indicating that the preference for one keyboard over the other actually reverses depending on the posture.
These "crossover" interactions are particularly important. In a lingerie context, this could mean that Style A is better than Style B with one pairing, but Style B becomes better than Style A with a different pairing.

Interpreting the ANOVA Table: The Golden Rule
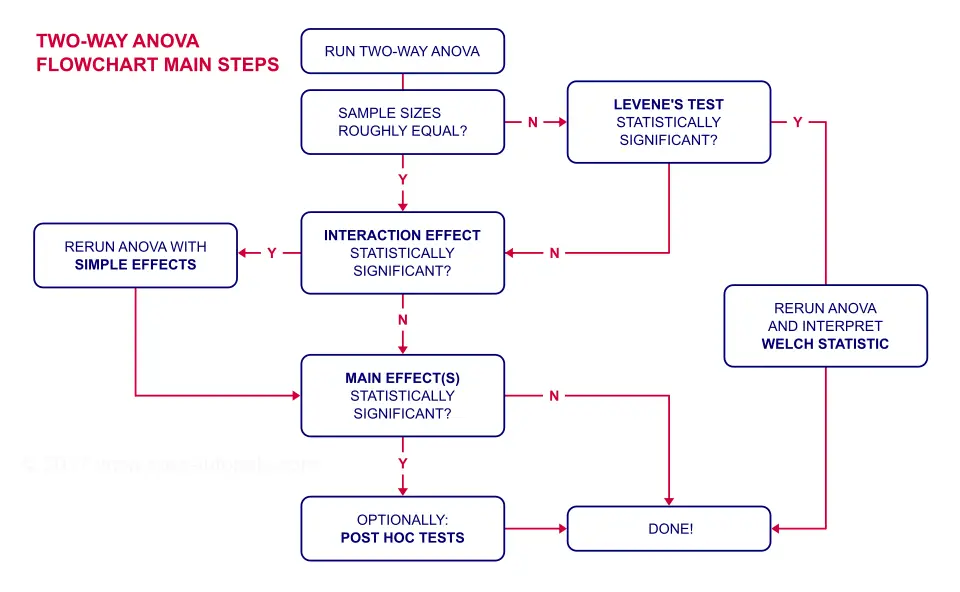
When you run a two-way ANOVA, you'll get a table with F-statistics and p-values for both main effects and the interaction. The analytical workflow is critical.
The Golden Rule: Always interpret the interaction p-value first.
-
If the interaction is significant (e.g., p < 0.05):
- Your primary conclusion is that the factors interact. The effect of Factor A depends on the level of Factor B.
- You should not interpret the main effects in isolation. A significant main effect can be misleading in the presence of a significant interaction. For example, the "average" effect of a bra style might be meaningless if its performance is great with one bottom and terrible with another.
- Your next step is to examine the group means (e.g., via interaction plots or simple effects tests) to understand the nature of the interaction. Which specific combinations are driving the effect?
-
If the interaction is not significant:
- You can conclude that there is no evidence of an interaction. The effect of Factor A is consistent across the levels of Factor B.
- In this case, you can proceed to interpret the main effects just as you would in a one-way ANOVA. A significant p-value for a main effect indicates that, on average, there is a difference between the levels of that factor.
The following flowchart provides a great visual summary of this decision process.
Let's dive a bit deeper into the reasoning and interpretation.
Interpreting results: Two-way ANOVA - GraphPad
This GraphPad article provides clear explanations for interpreting each of the p-values from a two-way ANOVA.
Please read the three subsections under the "P values" heading: Interaction P value Column factor P value Row factor P value Focus on why the main effect p-values are not meaningful when the interaction p-value is low.
For a deeper statistical perspective on why you shouldn't focus on main effects in the presence of an interaction, the "Learning statistics with R" text offers an excellent explanation. Given your background, this should provide a satisfying level of detail.
This section discusses the "peculiar interpretation issue" that arises when a significant interaction is present.
Read the subsection Interpreting the results. The author's example of a crossover interaction in a clinical setting clearly illustrates why focusing on the main effect can lead to useless conclusions.
Practice Exercise
Let's apply this to your lingerie photoshoot project. You want to test the effect of Bra Style (Plunge vs. Balconette) and Fabric (Satin vs. Lace) on the overall 'Look Appeal' score, rated out of 100. You run a full factorial experiment, getting ratings for all four combinations.
You obtain the following table of mean appeal scores:
| Satin | Lace | |
|---|---|---|
| Plunge Bra | 92 | 75 |
| Balconette Bra | 78 | 89 |
Your two-way ANOVA output looks like this:
| Source | df | F-statistic | p-value |
|---|---|---|---|
| Bra Style | 1 | 0.14 | 0.710 |
| Fabric | 1 | 0.42 | 0.521 |
| Bra Style * Fabric (Interaction) | 1 | 35.51 | < 0.001 |
| Residuals | 36 |
Your Task:
- Sketch the Interaction Plot: On a piece of paper or using any tool you like, create an interaction plot. Put 'Fabric' (Satin, Lace) on the x-axis. Use two separate lines to represent the two 'Bra Styles'.
- Interpret the Results: Following the "Golden Rule," analyze the ANOVA table. Start with the interaction term.
- Write Your Conclusion: Based on your interpretation, what is your practical recommendation for the photoshoot? Which specific combination(s) of bra style and fabric should be used to maximize the look's appeal?
Take a moment to work through this before reading the conclusion.
Conclusion
Today we've extended your experimental design capabilities from single-factor to multi-factor analysis. Two-way ANOVA allows you to build more efficient and realistic experiments that mirror the complexity of real-world design choices. You now have a framework for not just testing individual components, but understanding how they work together.
Key Takeaways:
- Two-way ANOVA tests for two main effects and one interaction effect.
- An interaction effect occurs when the effect of one factor is different at different levels of another factor. It's the statistical equivalent of saying "it depends."
- Always interpret the interaction effect first. If it's significant, focus on understanding the nature of that interaction (using plots or further tests) and be highly cautious about interpreting the main effects.
- Interaction plots are an essential tool for visualizing and understanding interaction effects. Non-parallel lines are a key indicator.
In this module, we've focused on formal, planned experiments for comparing group means. However, the creative process in a fitting room can also benefit from a more agile approach to hypothesis testing. In our next module, we will shift gears to look at simpler, non-parametric tests like the Sign Test, which are perfect for making quick, statistically-grounded decisions in pairwise comparisons (e.g., "Does the model prefer Outfit A or Outfit B?").