Welcome to the eighth module of our course, focusing on hypothesis testing in the dynamic environment of a fitting room. In the previous module, we mastered ANOVA, a powerful tool for comparing average numerical ratings across multiple lingerie styles in a structured experiment. While excellent for formal analysis, the fast-paced, iterative nature of a fitting room often calls for quicker, more flexible methods.
This lesson introduces the sign test, a simple yet effective non-parametric tool perfect for making decisions based on direct, qualitative feedback. Imagine you're with the model, and for a particular look, the question isn't "How would you rate this out of 10?" but simply, "Do you prefer Style A or Style B?". The sign test is designed for exactly this scenario. Our goal today is to learn how to translate these practical design questions into the precise language of null and alternative hypotheses, setting the stage for statistical validation.
The Scenario: Pairwise Preference Testing
In the "Fitting Room Experimentation" phase of your project, you'll often conduct pairwise comparisons. You might have the model try on two different bra styles with the same dress or two bottom styles with the same top. The goal is to determine if one is consistently preferred over the other.
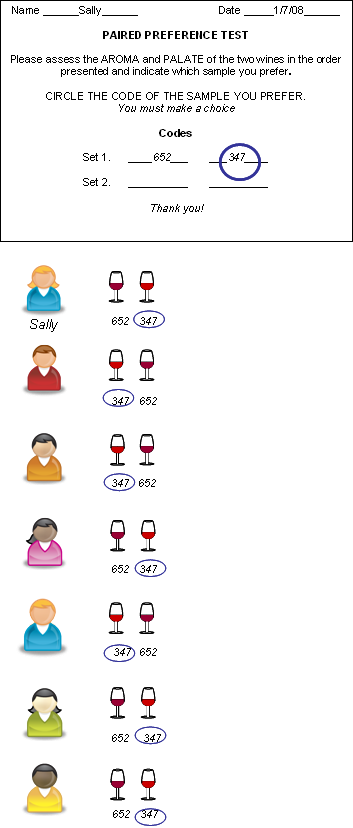
The data you collect isn't a continuous measurement like an appeal score, but rather a series of simple, directional preferences:
- For look 1, the model prefers the
plunge bra. - For look 2, she prefers the
balconette bra. - For look 3, she prefers the
plunge braagain. - For look 4, she has no preference.
This type of data—where you can say one option is preferred over another (A > B), but not by how much—is ideal for the sign test. It's a non-parametric method, which, as you know from your statistics background, means it doesn't require assumptions about the underlying data distribution (like normality). This makes it incredibly robust for subjective preference data.
The Wikipedia article on the sign test provides a concise and accurate overview of the test's purpose and its non-parametric nature.
Please read the introduction, from the beginning down to the end of the fifth paragraph. Pay close attention to the types of data it's suited for—comparisons that can be expressed as x > y, x = y, or x < y—and its key advantage of having very few underlying assumptions.
The Logic of the Sign Test
The sign test simplifies the comparison by focusing only on the direction of the preference. For each pair of tryouts, we record a "sign":
- A plus sign (+) if the model prefers Style A.
- A minus sign (-) if the model prefers Style B.
- A zero (0) if the model has no preference (a tie).
Pairs that result in a tie are typically excluded from the analysis, and the sample size is reduced accordingly. The test then proceeds by simply counting the number of pluses and minuses.
Formulating the Hypotheses
As with any formal statistical test, we must define a null hypothesis () and an alternative hypothesis ().
The Null Hypothesis (): The "No Preference" Scenario
The null hypothesis always represents the default state of "no effect" or "no difference." In the context of a preference test, states that there is no systematic preference for one style over the other. If this were true, the model would be equally likely to choose Style A as she is to choose Style B.
Statistically, we can define as the probability that one specific style (e.g., Style A) is preferred in any given trial. The null hypothesis is then:
This framing should be familiar; it's equivalent to testing if a coin is fair. Under the null hypothesis, each preference decision is like a coin flip. This connection makes the binomial distribution the natural tool for this test, which we will explore in the next lesson.
The "Method" section of the Wikipedia article formalizes this null hypothesis.
Please read the short section titled Method. Notice how it defines p as Pr(X > Y) and explicitly states the null hypothesis as H_0: p = 0.50. This is the foundational assumption we test against.
The Alternative Hypothesis (): What You Want to Find Evidence For
The alternative hypothesis represents the research question—the effect you are trying to detect. Its formulation depends on the question you are asking.
1. Two-Sided Alternative Hypothesis
This is used when you want to determine if there is any consistent preference, without specifying which style might be better. It's an exploratory approach.
- Question: "Is there a difference in preference between the lace balconette and the satin plunge bra?"
- Hypothesis:
- Interpretation: This tests if the true probability of preferring Style A is anything other than 50%. A significant result would mean there is a consistent preference in one direction or the other.
2. One-Sided Alternative Hypothesis
This is used when you have a directional hypothesis. For instance, you might be testing if a new design is an improvement over a classic one, or if a particular style you've championed is indeed preferred. This is often more powerful if you have a prior belief.
- Question: "Is the new seamless thong (Style A) preferred more often than the classic bikini cut (Style B)?"
- Hypothesis: , where
- Interpretation: You are specifically testing for evidence that Style A is chosen more than 50% of the time.
Conversely, if you were testing if Style A was less preferred:
- Question: "Is the experimental 'bondage-inspired' harness (Style A) considered less appealing than a standard garter belt (Style B)?"
- Hypothesis:
[PDF] Paired Sample Comparison.pdf - STATGRAPHICS
This document from STATGRAPHICS illustrates how these hypotheses are structured in statistical software.
First, read the paragraph explaining the competing hypotheses in the "Hypothesis Tests" section. Then, jump down to the "Pane Options" section and review the description for the Alt. Hypothesis option to see how one-sided and two-sided tests are specified.
Numerical Exercise
You are in the "Style Optimization" phase, comparing two bottom styles for a glamour photoshoot: a 'G-string' (Style G) and a 'Cheeky' panty (Style C). You hypothesize that the Cheeky style is more versatile and will be preferred by the model across a wider range of outfits.
You conduct 15 pairwise tryouts, pairing each bottom style with a different top or dress.
Your Task:
- Define the parameter in the context of this experiment.
- Formulate the null hypothesis () both in words and in statistical notation.
- Formulate the alternative hypothesis () that directly tests your suspicion, both in words and in statistical notation.
Take a few minutes to write down your answers before moving on.
Solution:
- Parameter : Let be the true probability that the model prefers the 'Cheeky' panty (Style C) over the 'G-string' (Style G) in a single, random pairwise comparison.
- Null Hypothesis ():
- In words: There is no preference between the 'Cheeky' panty and the 'G-string'. The model is equally likely to prefer either style.
- Notation:
- Alternative Hypothesis ():
- In words: The model prefers the 'Cheeky' panty over the 'G-string'.
- Notation:
This one-sided alternative hypothesis specifically captures your belief that the 'Cheeky' style will be preferred more than 50% of the time.
Conclusion
In this lesson, you've learned how to take a simple, practical question about preference and structure it into a formal statistical inquiry. This is a critical first step in hypothesis testing.
Key Takeaways:
- The sign test is a non-parametric test for paired data where the outcome is a directional preference (e.g., A > B).
- The null hypothesis for a two-style preference test is almost always that there is no preference, expressed as .
- The alternative hypothesis depends on your research question:
- for a two-sided test (Is there any preference?).
- or for a one-sided test (Is a specific style preferred?).
Now that you can correctly formulate the hypotheses, the next logical step is to test them. In our next lesson, we will do just that. You will learn how to conduct the sign test by using the binomial distribution to calculate a p-value and determine if a series of observed preferences is statistically significant.