Hello! Welcome back to our journey into Power Query.
In our last lesson, we focused on the crucial first step: importing data into Power Query from various sources like Excel and CSV files. We ended by highlighting the choice between "Load" and "Transform Data," emphasizing that "Transform Data" is our gateway to the data preparation workshop. This lesson picks up right at that moment.
Today, we will focus on the learning outcome: Navigate the Power Query interface and understand the 'applied steps' concept. Once you click "Transform Data," you enter the Power Query Editor. This is the environment where you'll teach the managers to perform all their data cleaning tasks. Understanding its layout and, most importantly, the 'Applied Steps' feature, is the foundation for everything that follows. This concept is the key to unlocking the automation that makes Power Query so powerful for business users.
Your Workshop: The Power Query Editor
The Power Query Editor opens in a separate window from Excel. At first glance, it might seem intimidating to a non-technical manager, so your first job as an instructor is to demystify it. A great way to start is with a guided tour.
The following video provides an excellent walkthrough of the Power Query Editor's main components.
Power Query - Beginner to PRO Masterclass in 30 minutes
To begin, watch this segment from the 'Power Query - Beginner to PRO' video by Chandoo. It provides a clear, high-level tour of the four main areas of the editor.
Watch from 03:50 to 06:49. Pay attention to how the presenter breaks the screen into four parts: the ribbon, the query list, the data preview, and the applied steps. This is a simple and effective way to introduce the layout to your workshop participants.
The Main Components of the Power Query Editor
As you saw in the video, the interface is logically structured. Let's formalize those components, as this will give you a clear framework for your teaching. The official Microsoft documentation and other guides break the editor into these key areas:
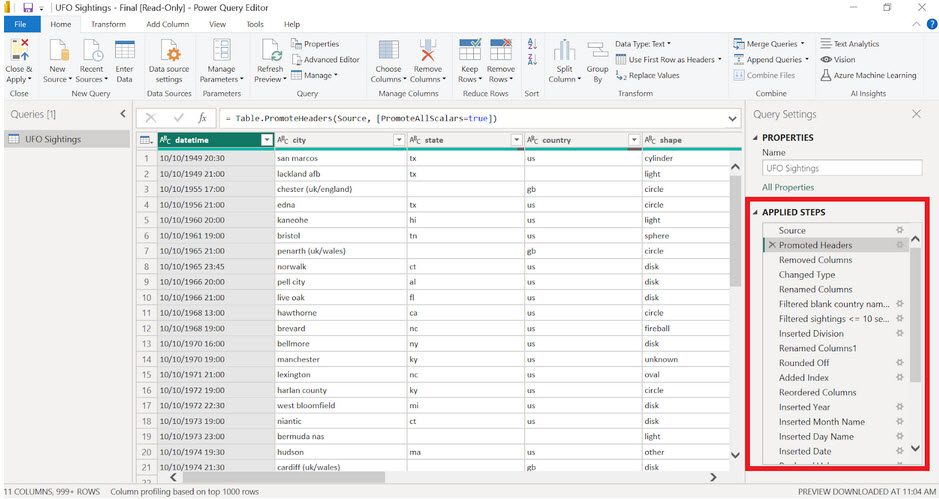
- The Ribbon: Just like in Excel, the ribbon at the top holds all the commands. It's organized into tabs like Home, Transform, Add Column, and View. You'll guide your users to the
Transformtab for modifying existing columns and theAdd Columntab for creating new ones. - Queries Pane: This panel on the left lists all the data connections (queries) you have in your current workbook. A manager might have one query for sales data, another for inventory, and a third that merges them. This pane allows them to switch between them.
- Data Preview: This is the main window, showing a sample of the data in the currently selected query. It's not the full dataset, but a large enough sample to see the effects of your transformations in real-time.
- Query Settings Pane: This is arguably the most important section, located on the right. It holds the name of your query and, crucially, the Applied Steps list.
- Formula Bar: Right below the ribbon, you might see a text box showing some code. This is the M formula language that Power Query writes for you. It's good to point this out to your workshop audience and let them know they can safely ignore it—Power Query is a no-code tool, and all actions are performed using the ribbon buttons. You can toggle this bar on and off from the View tab.
For a detailed textual breakdown that you could adapt for a handout, the following resource is excellent.
The Power Query user interface
The article 'The Power Query user interface' from Microsoft Learn provides the official terminology and description for each component of the editor.
Read the introductory section and the subsections 'The ribbon' and 'Expand and collapse panes'. This will solidify your understanding of the interface's layout and customizability. Note the five components it lists: Ribbon, Queries pane, Current view, Query settings, and Status bar.
The Heart of Automation: Understanding "Applied Steps"
Now, let's focus on the feature that enables automation: the Applied Steps list.
When you explain this to the managers in your workshop, an analogy can be very effective. Think of Applied Steps as a recipe.
- You start with your raw ingredients (the original data).
- As you perform each data cleaning action—like removing a column, filtering out rows, or correcting a data type—Power Query records it as a step in the recipe.
- The final result is your clean, ready-to-analyze dataset.
The magic happens when you get new data. Instead of manually cleaning it all over again, you just click "Refresh." Power Query then takes the new raw data and automatically re-runs every single step in your saved recipe, producing a clean dataset in seconds. This is the core concept that managers need to grasp.
Interacting with Your Steps
The Applied Steps list is not just a static record; it's an interactive tool for building and debugging your data cleaning process.
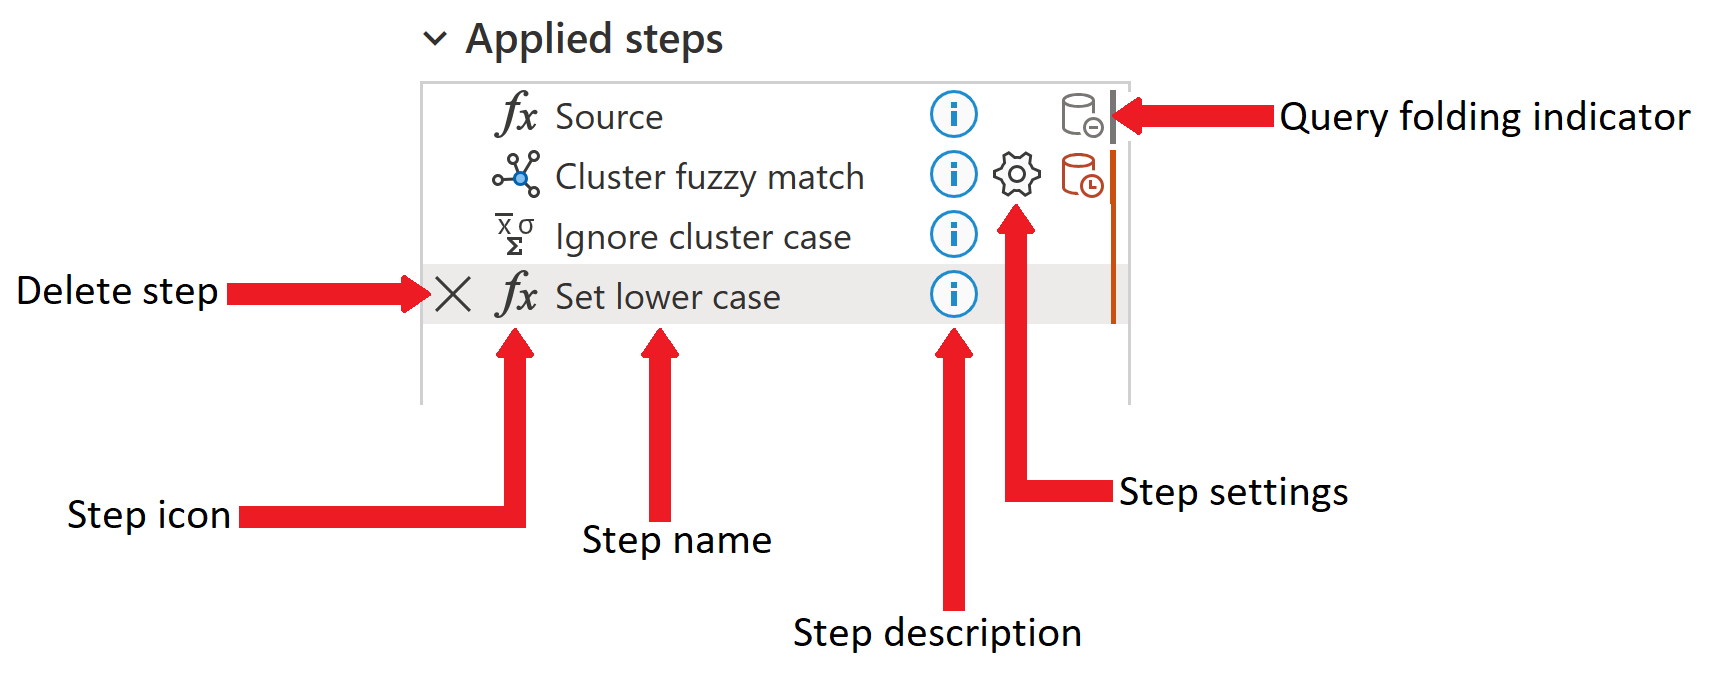
- Reviewing History: You can click on any step in the list to see what your data looked like at that specific point in the process. This is incredibly useful for troubleshooting. If something looks wrong, you can go back step-by-step to find where the error was introduced.
- Deleting Steps: If you make a mistake, you don't have to start over. Simply find the incorrect step in the list and click the 'X' icon next to it. The step is removed, and your data reverts to its state before that action.
- Editing Steps: Many steps have a small gear icon (⚙️) next to them. This allows you to edit the action without deleting it. For example, if you filtered a column to show only "USA," you can click the gear icon to change the filter to "Canada" instead.
This next video clip demonstrates exactly how to edit and manage these steps.
Power Query - Beginner to PRO Masterclass in 30 minutes
This clip from the Chandoo video shows the practical application of managing the Applied Steps list, including editing a step with the gear icon and the option to delete a step.
Watch from 21:50 to 23:07. Focus on how the presenter edits a 'Replaced Value' step using the gear icon to change the replacement text. Also, notice the mention of editing the 'Source' step to change a file path—a very common and practical task for managers.
Test your understanding!
A manager in your workshop has cleaned a sales report. In the process, they filtered the 'Region' column to show only "North." Now, their boss wants to see the data for the "South" region instead. How would you instruct the manager to make this change in the most efficient way, using the Applied Steps pane?
Show answer
The most efficient way is to edit the existing step. You would instruct the manager to:
- Look in the Applied Steps pane on the right.
- Find the step named something like "Filtered Rows."
- Click the gear icon (⚙️) next to that step.
- In the dialog box that appears, change the filter condition from "equals North" to "equals South."
- Click OK.
This avoids deleting the step and re-applying the filter from scratch, preserving the order of operations and making the change with minimal effort.
Conclusion
In this lesson, you've taken a tour of the Power Query Editor and delved into its most powerful feature, the Applied Steps list. You are now prepared to guide your workshop participants through this environment, giving them the confidence to start their data transformation journey.
Key Takeaways for Your Workshop:
- The Power Query Editor is a dedicated window for data transformation, with four main areas: the Ribbon, the Queries Pane, the Data Preview, and the Query Settings Pane.
- The Applied Steps list is the core of Power Query's automation. It records every cleaning and transformation action like a recipe.
- This "recipe" can be re-run on new data with a single click of the "Refresh" button in Excel.
- The Applied Steps list is interactive: you can review past states of the data, delete mistakes, and edit steps using the gear icon.
Preview of the Next Lesson:
Now that we are comfortable with the Power Query environment and understand how our actions are recorded, it's time to start learning the actions themselves. In the next module, we will begin with Core Data Cleaning Techniques in Power Query. You'll learn the specific steps to remove duplicates, filter rows, handle missing values, and more—building your first complete data cleaning recipe.