Hello! Welcome back to our course on building an AI workshop for industry managers.
In our last session, you learned how to teach managers to filter data, a crucial step for isolating the relevant information for their analysis. We've tackled removing duplicate rows and filtering for the right rows. But what about the data inside those rows? Often, datasets are incomplete, containing empty cells that can wreak havoc on calculations and reports.
This lesson addresses that exact problem. We will focus on how to handle missing values by removing or replacing them. By the end of this lesson, you'll be equipped to guide your workshop participants through the most common and effective techniques for dealing with gaps in their data using Power Query, ensuring their analyses are built on a solid foundation.
Why Missing Values are a Problem
Before teaching the "how," it's essential to explain the "why" to your audience of managers. Missing values aren't just an aesthetic issue; they have real-world consequences:
- Calculation Errors: Trying to perform mathematical operations (like sum or average) on a column with
nullvalues can lead to errors or incorrect results. - Skewed Analysis: If a significant number of values are missing, summary statistics like averages can be misleading.
- Failed Visualizations: Many charts and visuals in Power BI won't render correctly if critical data points are missing.
- Incomplete Picture: A report on regional performance is not very useful if the region is missing for 30% of sales records.
Your goal is to show them that cleaning up missing data is a non-negotiable step for creating reliable business intelligence.
Understanding "Missing": Null, Blank, and Error
In Power Query, not all "empty" cells are the same. It's important to understand the distinctions, as it affects how you handle them.
Dealing with Nulls & Blanks in Power Query: Best Practices|| From Nulls to Clean Data
First, let's clarify the difference between 'null' and 'blank' values. This video from Analytics with Asmi provides a concise explanation of how Power Query sees them.
Watch from 0:42 to 3:03. The key takeaway is that 'null' represents the complete absence of a value, while 'blank' is often an empty text string or whitespace. This distinction is crucial for later steps.
To summarize:
- Null: This is Power Query's formal representation of a missing or unknown value. It will appear as
nullin italics in a cell. - Blank (or Empty String): This is a text value that contains no characters. It looks empty but is technically a piece of text.
- Error: Sometimes, a value from a source file (like
#N/Ain Excel) or a failed data type conversion will appear as anError.
A great first step in any data cleaning process is to get a quick overview of data quality. Power Query has a built-in feature for this. In the View tab, you can enable Column quality. This adds a small bar under each column header showing the percentage of data that is valid, has errors, or is empty. This is a fantastic tool to show managers, as it instantly highlights which columns need attention.
Strategy 1: Removing Rows with Missing Values
The most straightforward approach is to simply remove any row that contains a missing value. This is appropriate when the missing data is in a critical column, making the entire row unusable. For example, if you're analyzing sales data, a row with a missing sales amount is not very helpful.
There are a few ways to do this:
- Filter out
nulls: Just like you learned in the previous lesson, you can click the filter dropdown on a column and unchecknull. - Remove Blank Rows: This option is for rows that are entirely empty across all columns.
Learn to Automate Everything with Power Query in Excel (Download Files)
Watch this clip from Leila Gharani's comprehensive Power Query tutorial to see how to remove rows that are completely blank.
Watch from 08:47 to 09:34. This demonstrates the 'Remove Blank Rows' feature, which is a quick way to clean up empty lines that often appear in data exports.
- Remove Errors: If a column contains
Errorvalues, you can remove those specific rows.
Dealing with errors - Power Query
The official Microsoft documentation, 'Dealing with errors', explains how to handle cell-level errors. This section shows how to remove rows containing them.
Read the sub-section titled 'Remove errors'. This is a simple but powerful command found in the 'Home' tab under 'Remove Rows'.
Caution for your workshop: Advise managers to be careful. Removing rows means losing data. If a row has valuable information in other columns, it might be better to replace the missing value instead of deleting the whole row.
Strategy 2: Replacing Missing Values
Often, a better approach than removing rows is to replace the missing values with something meaningful. This preserves the rest of the data in the row.
Common replacements include:
- Replacing
nullin a numerical column (e.g.,Sales,Quantity) with 0. - Replacing
nullin a text column (e.g.,Comments,Category) with a placeholder like "N/A" or "Unknown".
The primary tool for this is Replace Values, which can be found in the Transform tab or by right-clicking a column.
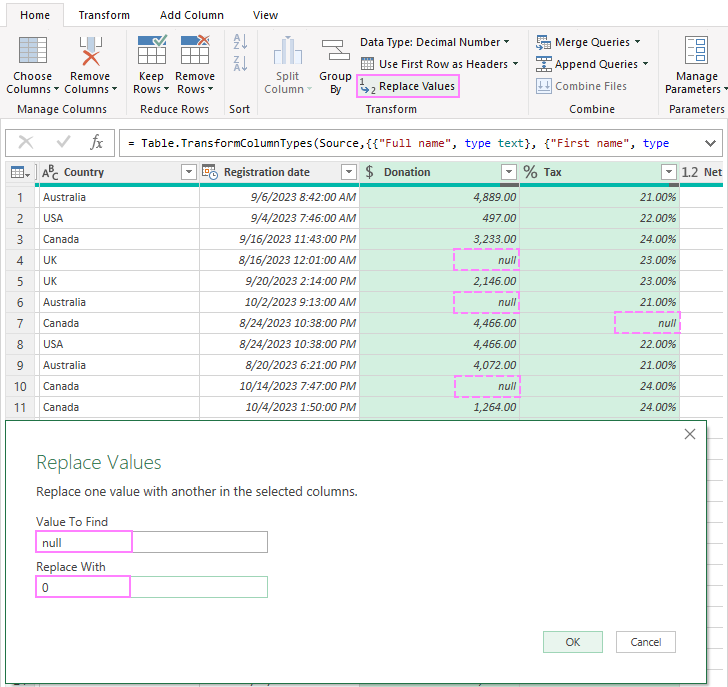
The process is straightforward for null values, but can be slightly different for blanks and errors.
Dealing with Nulls & Blanks in Power Query: Best Practices|| From Nulls to Clean Data
This clip from 'Analytics with Asmi' demonstrates how to use the 'Replace Values' function for both numeric and text columns.
Watch from 06:22 to 08:21. Notice how you can replace a null in a number column with '0' and a null in a text column with a string like 'Error'.
Handling Blanks and Errors:
- Replacing Blanks: As you learned earlier, Power Query treats blanks (empty text) differently from
null. To replace a blank, you would enter nothing in the "Value to Find" box of theReplace Valuesdialog. For robustness, it's often best to firstTrimthe column (under theFormatmenu) to remove hidden whitespace, and then replace the empty values. - Replacing Errors: Instead of
Replace Values, you use the Replace Errors option. The same Microsoft documentation shows how to do this. In theReplace errorsdialog, you simply provide the value you want to use as a replacement.
Strategy 3: Filling Missing Values (Fill Down / Fill Up)
This is a powerful technique for a specific, but common, type of messy data: reports where a value is only entered once and applies to all subsequent rows until a new value appears.

The Fill command (found in the Transform tab or by right-clicking a column) has two options:
- Down: Fills
nullvalues by copying the value from the cell above. - Up: Fills
nullvalues by copying the value from the cell below.
This is an incredibly useful automation step that saves managers from tedious copy-pasting.
Fill values in a column - Power Query
The Microsoft Learn article 'Fill values in a column' provides a clear, step-by-step guide on using both 'Fill Down' and 'Fill Up'.
Read the introduction and the sections 'Fill down' and 'Fill up'. Pay close attention to the tip in the 'Fill up' section about first replacing empty cells with 'null' before the fill operation can work. This is a crucial practical detail to teach.
Test your understanding!
A manager has a product inventory report exported from a legacy system. The report looks like this:
| Category | Product ID | Stock Level |
|---|---|---|
| Electronics | 5001 | 45 |
null |
5002 | 102 |
null |
5003 | null |
| Office | 8001 | 210 |
null |
8002 | 88 |
To make this data usable for a Power BI dashboard, what two data cleaning steps related to missing values must be performed, and in what order?
Show answer
- Step 1: Fill Down. Select the
Categorycolumn and use theFill -> Downcommand. This will propagate "Electronics" and "Office" into thenullcells below them. - Step 2: Replace Values. Select the
Stock Levelcolumn and use theReplace Valuescommand to replacenullwith0. This ensures the column can be used in calculations without errors.
The order matters here. You need to establish the categories first before you handle the numeric nulls to ensure all rows are correctly categorized.
Conclusion
You are now prepared to teach managers the essential techniques for handling missing data. This is a critical part of the data cleaning process that builds trust and accuracy into any analysis.
Key Takeaways for Your Workshop:
- Missing data (
null, blanks, errors) can break calculations and lead to bad decisions. - Always start by inspecting data quality with the Column quality view.
- You can handle missing values by removing the entire row (use with caution), replacing the value with something meaningful (like 0 or "N/A"), or filling down/up from adjacent cells.
- All these steps are recorded by Power Query and are fully automated for the next data refresh.
Preview of the Next Lesson:
We've cleaned our data by removing duplicates, filtering rows, and handling missing values. Now, the data is trustworthy, but is it in the right shape for analysis? In our next lesson, we will explore how to split a single column into multiple columns and merge multiple columns into one, further preparing our data for modeling and visualization.