Hello! Welcome to the sixth lesson in our module on consumer choice.
In our last session, we took a deep dive into the Slutsky equation, which was a powerful tool for dissecting the effect of an infinitesimal price change into substitution and income components. We saw that the total change in demand, , is the sum of these two effects.
Today, we will broaden our perspective. We'll move from analyzing a single derivative to understanding the overall behavior of demand functions. This is the field of comparative statics: the study of how a model's equilibrium outcome (here, the consumer's optimal choice) changes when its underlying parameters (prices and income) are varied. We will use the calculus tools we've developed to formally describe how demand curves shift and what fundamental properties they must satisfy.
Learning Outcome: By the end of this lesson, you will be able to analyze how changes in prices and income shift demand using comparative statics.
1. What is Comparative Statics? The Big Picture
At its core, economic modeling is about building a simplified representation of the world and then running "thought experiments." Comparative statics is the methodology for these experiments. We start with a system in equilibrium, change one parameter, and compare the new equilibrium to the old one.
For the consumer's problem, the equilibrium is the optimal consumption bundle . The parameters are prices and income . Our "thought experiments" will involve asking questions like:
- How does the optimal bundle change if income increases?
- How does the quantity demanded of good 1 change if its own price rises?
- How does the quantity demanded of good 1 change if the price of good 2 rises?
Mathematically, this amounts to calculating and interpreting the partial derivatives of the Marshallian demand functions. Graphically, it involves tracing how the optimal bundle moves and using that path to derive fundamental relationships like demand curves and Engel curves.
Let's begin by building the graphical intuition for this process.
Price Offer Curve, Income Offer Curve, Demand Curve and Engel Curve (for Micro Theory Students)
This video from Ashley Hodgson provides an excellent visual derivation of the key relationships in comparative statics. It shows how changing prices or income leads to the construction of the Price Offer Curve, Demand Curve, Income Offer Curve, and Engel Curve.
Please watch from 04:17 to 11:10. The first part (04:17 - 08:32) shows how varying the price of a good traces out a 'Price Offer Curve' in the consumption space, and how this directly maps to a standard 'Demand Curve'. The second part (08:32 - 11:10) does the same for changes in income, tracing out an 'Income Offer Curve' and its corresponding 'Engel Curve'.
This video provides the visual foundation. The Price Offer Curve and Income Offer Curve show the path of the optimal bundle in the space as a parameter changes. The Demand Curve and Engel Curve then isolate one good and plot its optimal quantity against the changing parameter. Now, let's formalize these relationships with calculus.
2. Analyzing the Effects of Parameter Changes
A. Income Changes and the Engel Curve
When a consumer's income changes, the budget constraint shifts in or out in a parallel fashion. The response of demand is captured by the partial derivative with respect to income, .
- A good is defined as normal if consumption increases as income increases: .
- A good is defined as inferior if consumption decreases as income increases: . (e.g., instant noodles, bus travel).
The Engel curve for good is a plot of the quantity demanded, , against income, . The slope of the Engel curve is precisely , so upward-sloping Engel curves correspond to normal goods, and downward-sloping ones correspond to inferior goods.

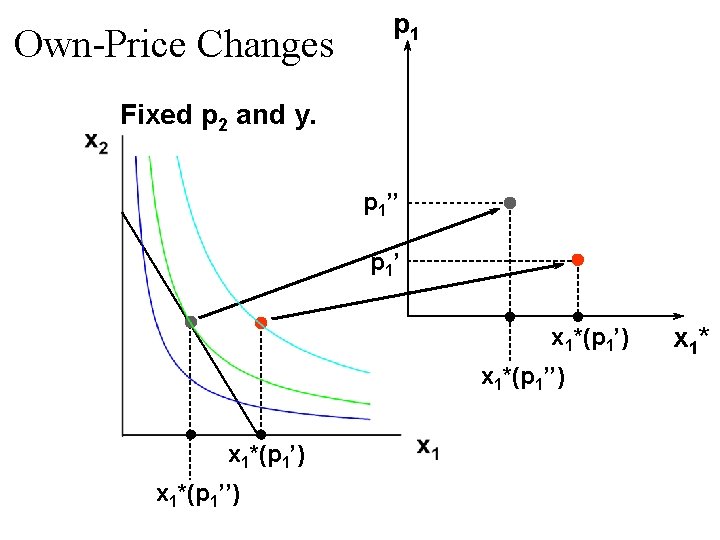
B. Own-Price Changes and the Demand Curve
The relationship between the quantity demanded of a good and its own price is perhaps the most famous in economics. The slope of the demand curve is related to the derivative .
As we saw in the last lesson with the Slutsky equation, this derivative is composed of two parts:
The substitution effect, , is always non-positive. The sign of the income effect depends on whether the good is normal or inferior. This leads to two main possibilities for the total effect:
- Ordinary Good: Demand falls when its price rises, . This is the standard case, resulting in a downward-sloping demand curve. This always happens for normal goods (where the income effect is also negative, reinforcing the substitution effect) and for most inferior goods.
- Giffen Good: Demand rises when its price rises, . This is a rare case where a good is so strongly inferior that the positive income effect ( becomes positive and outweighs the negative substitution effect. This results in an upward-sloping demand curve.
C. Cross-Price Changes: Substitutes and Complements
Finally, we can analyze how the demand for one good changes when the price of another good changes. This is measured by the cross-price derivative, for .
- Goods and are gross substitutes if an increase in the price of good leads to an increase in the demand for good : . (e.g., coffee and tea).
- Goods and are gross complements if an increase in the price of good leads to a decrease in the demand for good : . (e.g., coffee and sugar).
The term "gross" is used because this definition is based on the Marshallian demand function, which includes both substitution and income effects. The Slutsky equation for cross-price effects, , shows that the income effect can sometimes complicate the relationship.
3. A Fundamental Property: Homogeneity
Marshallian demand functions have a crucial property: they are homogeneous of degree zero in all prices and income. Mathematically, this means:
In words, if you scale all prices and income by the same positive factor , the quantity demanded does not change. This is often called the principle of "no money illusion." A rational consumer's choices depend on real quantities—relative prices and real purchasing power—not on the nominal units of currency. Doubling all prices and your income doesn't make you any richer or poorer, and the relative trade-offs between goods remain the same, so your optimal consumption bundle should not change.
Let's see a proof of this property for the Cobb-Douglas case, which also serves as a great review of the properties we've just discussed.
Properties of Marshallian Demand Functions
This video by Justin Eloriaga provides concise mathematical proofs for several properties of Marshallian demand, starting with homogeneity of degree zero.
Please watch from 01:10 to 10:02. The first segment (01:10 - 05:27) proves that Marshallian demand is homogeneous of degree zero. The following segments then prove that demand is increasing in income (for a normal good) and decreasing in its own price, reinforcing what we've just discussed.
4. Further Reading and Practice
To solidify these concepts, the following reading provides more examples and some excellent practice problems that directly test your understanding of comparative statics. Given your background, working through the calculus will be the best way to internalize the material.
[PDF] Chapter 7: Demand Function
This document from the University of Western Ontario provides several examples of deriving demand functions and analyzing their comparative statics.
Read Section 1 (pages 1-5), which walks through deriving demand functions and their comparative statics for Cobb-Douglas, perfect substitute, and quasilinear preferences. Then, I strongly recommend you try Exercise 1 on page 6. It asks you to perform the exact analysis we've covered today: derive a demand function, graph the demand and Engel curves, and calculate the relevant partial derivatives to classify the good. This is an excellent self-assessment.
Conclusion
Today we formalized the process of comparative statics in consumer theory. By taking partial derivatives of the Marshallian demand function , we can precisely predict how demand responds to changes in the economic environment.
Key Takeaways:
- Comparative statics is the analysis of how endogenous variables (like quantity demanded) respond to changes in exogenous variables (prices and income).
- The sign of determines if a good is normal or inferior and gives the slope of the Engel curve.
- The sign of determines if a good is ordinary or Giffen and gives the slope of the demand curve.
- The sign of determines if goods are gross substitutes or gross complements.
- Marshallian demand functions are homogeneous of degree zero in prices and income, meaning consumers are free from "money illusion."
Preview for the Next Lesson:
We have now thoroughly analyzed the consumer's optimal choice, . But what about the value the consumer gets from this choice? In the next lesson, we will construct and analyze the indirect utility function, , which tells us the maximum utility achievable at given prices and income, and revisit the expenditure function, . We will discover some powerful connections between these "value functions" and the demand functions we've been studying.