Introduction
In our last lesson, we established how to measure a country's total economic output, Gross Domestic Product (GDP), using three equivalent approaches. We calculated GDP by summing expenditures, incomes, or the value added at each stage of production. However, all those calculations yielded what we call nominal GDP, which is valued at current market prices. This presents a challenge: if nominal GDP increases from one year to the next, is it because the economy is producing more, or simply because prices have risen?
This lesson addresses that ambiguity head-on. Your objective is to learn how to convert nominal GDP to real GDP and calculate the GDP deflator. This will allow you to disentangle the effects of changing output from changing prices—a crucial skill for any economic analysis. Given your background in statistics, you'll find the concept of creating an index to measure price changes and using a base year to control for price effects quite intuitive. We will focus on the precise calculations that allow for this distinction.
Separating Quantity and Price: Real GDP
Nominal GDP is calculated by valuing the goods and services produced in a given year using the prices of that same year.
where and are the prices and quantities in the current year .
To get a measure of output that isn't affected by price changes, we create real GDP. The method is straightforward: we value the output of each year using the prices from a fixed base year. This isolates changes in quantity () because the price () is held constant.
where are the prices in the chosen base year.
The following video provides a clear, step-by-step example of calculating both nominal and real GDP for a simple economy.
How to Calculate Nominal GDP, Real GDP, and GDP Deflator
This video from the "Economics in Many Lessons" channel demonstrates the core calculations for nominal and real GDP.
First, watch the brief segment on calculating nominal GDP from the start to refresh the concept. Then, pay close attention to the section on real GDP from this point. Notice how the prices from the base year (2019 in this case) are consistently used to calculate the real GDP for all three years (2018, 2019, and 2020), thereby measuring the actual change in the volume of production.
An important point to note is that in the base year, prices from the current year are the base year prices. Therefore, for the base year only, nominal GDP always equals real GDP.
Measuring the Price Level: The GDP Deflator
Now that we have a measure for output (Real GDP) and a measure for the value of that output at current prices (Nominal GDP), we can derive a measure for the overall price level. This measure is an index number called the GDP deflator.
The GDP deflator is calculated as the ratio of nominal GDP to real GDP, multiplied by 100.
Think of it as a measure of how much prices have changed on average since the base year.
- If the GDP deflator is 100, it means the average price level is the same as in the base year. As we noted, this is always the case for the base year.
- If the GDP deflator is, for example, 110, it means the overall price level has risen by 10% since the base year.
- If it is 95, the price level has fallen by 5% since the base year.
Let's continue with the same video to see how the GDP deflator is calculated from the nominal and real GDP figures we just discussed.
How to Calculate Nominal GDP, Real GDP, and GDP Deflator
This final segment of the video explains and calculates the GDP deflator.
Watch from the explanation of the formula. Observe the calculation for each year and confirm that the deflator for the base year (2019) is indeed 100.
The GDP Deflator in Practice: Solving for Missing Variables
The formula for the GDP deflator connects three key variables: nominal GDP, real GDP, and the deflator itself. In practical applications or exam questions, you may be given any two of these and asked to find the third. This requires a simple algebraic rearrangement of the formula.
For example, if you are given nominal GDP and the GDP deflator, you can find real GDP by rearranging the formula as follows:
The next video demonstrates exactly this type of problem.
How to Calculate the GDP Deflator
This video, also from "Economics in Many Lessons," provides an excellent example of a slightly more complex problem involving the GDP deflator.
Watch the segment from where the problem is introduced. Follow the algebraic steps used to isolate and solve for real GDP. This type of "reverse" calculation is a common way to test your understanding of the relationship between these variables.
Application Exercise
Now, let's apply these concepts to a typical problem. The table below contains data for an economy over several decades. Some cells are missing. Your task is to use the formulas we've covered to fill in the blanks.
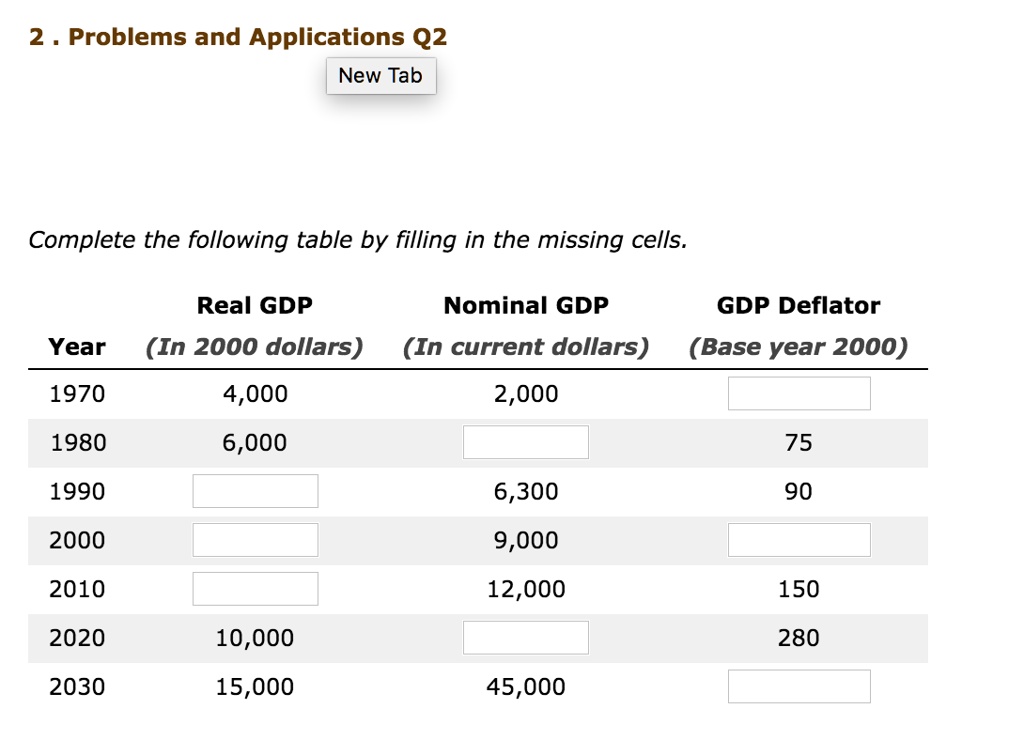
Let's work through the first few together:
- For 1970: We have Nominal GDP = 2,000 and Real GDP = 4,000.
- For 1980: We have Real GDP = 6,000 and GDP Deflator = 75. We need to find Nominal GDP. Rearranging the formula:
- For 1990: We have Nominal GDP = 6,300 and GDP Deflator = 90. We need to find Real GDP.
Now, try calculating the missing values for the years 2000, 2010, 2020, and 2030 on your own. Remember that 2000 is the base year, which provides a useful check for one of your answers.
Click to see the solutions
- 2000: (Base Year) Real GDP = 9,000, GDP Deflator = 100.
- 2010: Real GDP = 8,000.
- 2020: Nominal GDP = 28,000.
- 2030: GDP Deflator = 300.
Deeper Understanding: A Conceptual Question
The following problem provides some final calculation practice and poses an interesting conceptual question to test your grasp of these ideas.
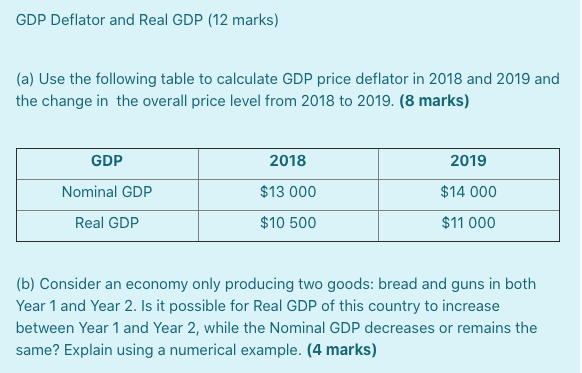
First, complete Part (a) to practice the basic calculation.
For Part (b), consider the relationship .
An increase in Real GDP means the quantity of output has gone up. A decrease in Nominal GDP means the current market value of that output has gone down. Is this possible?
Yes, it is. This can happen if the fall in the price level (deflation) is proportionally larger than the rise in the quantity of output.
Let's construct a simple one-good economy to prove this:
- Year 1 (Base Year):
- Price = $10, Quantity = 100 units
- Nominal GDP = 10 * 100 = $1,000
- Real GDP = 10 * 100 = $1,000
- Year 2:
- Let's say output increases by 10% to 110 units. This is an increase in Real GDP.
- Now, let's say prices fall dramatically, by 20%, to $8.
- New Nominal GDP = 8 * 110 = $880
- New Real GDP (using Year 1 prices) = 10 * 110 = $1,100
In this scenario, Real GDP increased from $1,000 to $1,100 (a 10% increase), while Nominal GDP decreased from $1,000 to $880 (a 12% decrease). This occurred because the 20% price drop more than offset the 10% quantity increase.
Conclusion
In this lesson, we have moved beyond the simple measurement of nominal GDP to a more nuanced understanding of economic performance. By distinguishing between real and nominal values, you can now parse out the effects of price changes versus changes in actual production.
Key Takeaways:
- Nominal GDP measures output using current prices, so it can be influenced by both production and price changes.
- Real GDP measures output using constant base-year prices, making it a pure measure of the quantity of goods and services produced.
- The GDP Deflator is a price index calculated as . It measures the change in the overall price level relative to the base year.
- In the base year, Nominal GDP equals Real GDP, and the GDP Deflator is 100.
- The three variables are linked by a single formula, which can be rearranged to solve for any unknown variable given the other two.
The GDP deflator is our first tool for measuring inflation. In the next lesson, we will introduce another major price index, the Consumer Price Index (CPI). We will learn how to calculate it, compare its strengths and weaknesses relative to the GDP deflator, and use both indices to calculate the rate of inflation.