Introduction
In our last lesson, we investigated the powerful relationship between price elasticity and a firm's total revenue, using the total revenue test and deriving the formula connecting marginal revenue to elasticity. We focused on how quantity demanded responds to a change in a good's own price.
Today, we broaden our application of elasticity by turning our attention to another crucial determinant of demand: consumer income. This lesson introduces income elasticity of demand (YED). We will define this measure, establish the formulas for its calculation, and most importantly, use its value to classify goods into distinct categories—a fundamental skill in economic analysis. By the end of this lesson, you will be able to calculate YED from data and determine whether a good is a normal good, an inferior good, a necessity, or a luxury.
Defining and Interpreting Income Elasticity of Demand (YED)
Income elasticity of demand, often denoted as or YED, measures the responsiveness of the quantity demanded of a good to a change in consumer income, holding all other factors (like price) constant.
The basic formula is a familiar structure:
Unlike price elasticity, which is almost always negative, the sign of the income elasticity coefficient is a critical piece of information that tells us about the nature of the good. The magnitude of the coefficient provides a further layer of classification.
To understand these classifications, please watch the following video. It clearly explains how to interpret the sign and magnitude of YED.
Y1 14) Income Elasticity of Demand (YED)
The video "Y1 14) Income Elasticity of Demand (YED)" from EconplusDal offers an excellent introduction to the concept and its interpretation.
Watch from the beginning to the explanation of the classifications. Focus on: The definition and the basic formula for YED. How a positive sign indicates a normal good. How a negative sign indicates an inferior good. The distinction within normal goods: necessities versus luxuries, based on whether the value is less than or greater than 1.
Based on the video, we can summarize the classifications as follows:
-
Normal Goods (): As income rises, the quantity demanded for these goods also rises.
- Necessity Goods (): Demand is income inelastic. As income rises, demand increases, but by a smaller percentage. These are goods consumers buy regardless of their income level, like basic foodstuffs or utilities.
- Luxury Goods (): Demand is income elastic. As income rises, demand increases by a larger percentage. Examples include sports cars, fine dining, and exotic vacations.
-
Inferior Goods (): As income rises, the quantity demanded for these goods falls. Consumers substitute away from these goods toward better alternatives as they become wealthier. Examples often include instant noodles, budget public transportation, or generic-brand products.
The diagram below visually represents these categories through Engel curves, which plot the relationship between income and the quantity of a good demanded.

Calculating Income Elasticity of Demand
As with price elasticity, there are different methods for calculating income elasticity, depending on the data provided. Your exam syllabus requires familiarity with calculations using both original quantities (a simple percentage change) and average quantities (the arc or midpoint method).
1. The Standard Percentage Change Method
This method calculates the percentage change based on the initial values of income and quantity.
The EconplusDal video you watched earlier uses this method in its worked examples. Let's revisit it to see the calculations in action.
Y1 14) Income Elasticity of Demand (YED)
This video provides two clear numerical examples using the standard percentage change method.
Please watch the two examples presented: Fast food example: Note how the negative result (E_Y = -0.8) leads to the classification of fast food as an income-inelastic inferior good. Furniture example: Observe how the positive result greater than one (E_Y = +3) identifies furniture as an income-elastic normal luxury.
2. The Arc (Midpoint) Formula
For discrete changes between two points, the arc or midpoint formula provides a more accurate measure of elasticity by using the average of the initial and final values as the base for percentage changes. This avoids the "base problem," where the calculated elasticity depends on the direction of the change. Given your background in statistics, you will recognize this as a way to get a consistent estimate over an interval.
Income elasticity of demand - Wikipedia
The Wikipedia page on Income Elasticity of Demand provides a concise summary of the different mathematical formulas.
Focus on the formula provided for discrete changes, which is the arc elasticity formula. It is defined as: E_Y = \frac{(Q_2 - Q_1)}{(Q_1 + Q_2)/2} \div \frac{(Y_2 - Y_1)}{(Y_1 + Y_2)/2} = \frac{\Delta Q}{\Delta Y} \times \frac{Y_1+Y_2}{Q_1+Q_2}
The following video demonstrates how to apply this specific formula.
How to Calculate the Income Elasticity of Demand
This video from the channel Economics in Many Lessons, "How to Calculate the Income Elasticity of Demand," focuses exclusively on the midpoint method.
Watch the entire video from start to finish. The two examples—lobster as a normal good and "Good X" as an inferior good—clearly show the step-by-step application of the midpoint formula.
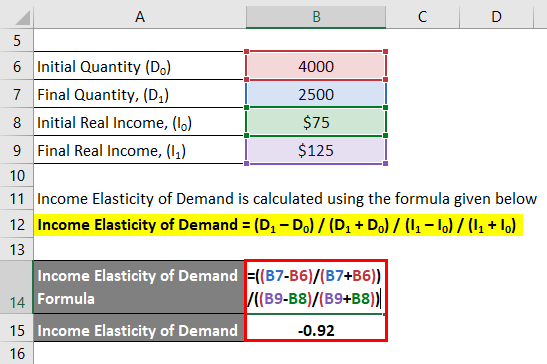
The Excel calculation shown in the image below also uses this midpoint formula, reinforcing the steps from the video.
Application: Exam-Style Problem
Let's now apply these concepts to a question typical of what you might encounter in your CB2 exam. This problem is taken directly from the provided exam booklet.
This booklet contains past exam questions. We will focus on a specific short-answer question involving the calculation of YED.
Please find question 17 on page 47 of the PDF. We are interested in part (ii)(b), which reads: "calculate the income elasticity". You'll also need the initial data from part (ii): "The demand for Good X is 260 units per year when price is £2.50 per unit."
Problem:
Initially, the demand for Good X is 260 units per year. If consumer income increases from £23,000 to £26,000 per year and demand for Good X rises to 320 units per year, calculate the income elasticity of demand for Good X.
Solution:
Let's solve this using both methods, as required by your syllabus.
Method 1: Standard Percentage Change (Original Method)
- Initial Quantity (): 260
- Final Quantity (): 320
- Initial Income (): £23,000
- Final Income (): £26,000
Method 2: Arc (Midpoint) Method
You can verify these answers in the solutions section of the booklet (page 74).
Interpretation:
In both cases, is positive and greater than 1.
- The positive sign tells us that Good X is a normal good.
- The magnitude greater than 1 tells us that demand is income elastic, meaning Good X is a luxury good.
A 1% increase in income leads to approximately a 1.7% increase in the quantity demanded of Good X.
Conclusion
Today we have expanded our toolkit of elasticity measures to include income elasticity of demand. You are now equipped to calculate how demand for a product changes as consumer incomes fluctuate and to use this calculation to make important classifications about the nature of a good.
Key Takeaways:
- Income Elasticity of Demand (YED) measures the responsiveness of quantity demanded to a change in consumer income.
- The sign of YED is crucial: a positive sign indicates a normal good, while a negative sign indicates an inferior good.
- The magnitude of YED for a normal good allows for further classification: it is a necessity if and a luxury if .
- YED can be calculated using the standard percentage change formula or the more precise arc (midpoint) formula, both of which are required for your exam.
In our next lesson, we will complete our trio of major demand elasticities by exploring cross-price elasticity. This will allow us to quantify the relationship between goods, determining whether they are substitutes or complements.