Introduction
Welcome to our first lesson on international trade. In the previous module, we focused on the indicators and objectives for a single, national economy, culminating in our discussion of potential output and the business cycle. We now broaden our scope to see how economies interact through trade.
This lesson addresses a fundamental question: why do nations trade with each other? The simple answer is that trade allows countries to consume more than they could produce on their own. The key to unlocking this benefit lies in the principle of comparative advantage. Today, we will revisit the concept of opportunity cost, which you first encountered in our earliest lessons, and apply it to a two-country, two-good model to determine the basis for trade. Your goal for this lesson is to master the calculation of opportunity costs to identify which country should specialize in producing which good.
The Ricardian Model and the Basis for Trade
To analyze trade patterns rigorously, we use the Ricardian model, named after the 19th-century economist David Ricardo. This model simplifies the world to its essentials to provide a clear proof of the gains from trade.
The core assumptions are:
- Two countries and two goods.
- Labor is the only factor of production.
- Labor productivity is constant for each good within a country but may differ across countries.
- Labor is mobile between sectors within a country but immobile between countries.
- Markets are perfectly competitive.
To begin, let's watch a short video that introduces these assumptions and the concept of the Production Possibility Frontier (PPF) in this context.
[International Trade] Ricardian Model |Part 1| Production Possibility Frontier in Home & Foreign |3|
This video, "[International Trade] Ricardian Model |Part 1|," clearly outlines the foundational assumptions of the model we will be using.
Please watch the first part of the video, from the introduction, to familiarise yourself with the basic setup of the Ricardian model.
Within this framework, we distinguish between two types of advantages:
- Absolute Advantage: A country has an absolute advantage in producing a good if it can produce a unit of that good using fewer resources (in this model, less labor) than the other country.
- Comparative Advantage: A country has a comparative advantage in producing a good if it can produce that good at a lower opportunity cost than the other country.
While absolute advantage is intuitive, it is comparative advantage that forms the true basis for mutually beneficial trade. A country doesn't need to be best at producing something in absolute terms to gain from specializing in it.
Calculating Opportunity Cost
The opportunity cost of producing one more unit of a good is the amount of the other good that must be given up. Your background in quantitative analysis will be very helpful here, as we can express this relationship precisely.
There are two common ways production data is presented:
- Unit Labor Requirement (): The amount of labor (e.g., hours) needed to produce one unit of a good. This is an "input" approach.
- Labor Productivity (MPL): The amount of output produced by one unit of labor. This is an "output" approach. These two are reciprocals of each other: .
Let's see how to calculate opportunity cost in each case.
Method 1: Using Unit Labor Requirements (The "Input" Method)
Let be the unit labor requirement for good X and be the unit labor requirement for good Y. To produce one more unit of X, you need hours of labor. If you move these hours from the Y industry, you give up the ability to produce units of Y.
Therefore, the opportunity cost of good X is units of good Y.
Let's consult a set of academic slides that formalizes this.
[PDF] 1.4 — Ricardian One-Factor Model - ECON 324 • International Trade
These slides from a university course on International Trade provide the mathematical foundation for our calculations.
First, review the section that details the model setup. Focus on the equation for the PPF, l_x x + l_y y = L, and note how its slope, -l_x/l_y, represents the opportunity cost of good x. Then, read the section that defines Absolute and Comparative Advantage. Notice the formula for comparative advantage is just a comparison of the opportunity costs (the PPF slopes) between two countries.
Method 2: Using Production Output (The "Output" Method)
Often, problems are framed in terms of how much each country can produce with its resources. For example, "Country A can produce 1,000 cars or 1,000 jetpacks."
To find the opportunity cost of a car, you ask: if I produce one more car, how many jetpacks do I give up? In this simple case, since resources can produce equal amounts of both, the opportunity cost of 1 car is 1 jetpack. The general formula is:
A quick way to perform this calculation is the "other goes over" method. For the opportunity cost of cars, the output of jetpacks "goes over" the output of cars.
The image below illustrates this calculation.
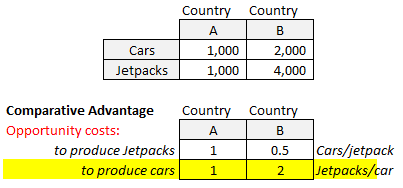
Let's verify the calculations for Country B from the image:
- Maximum Cars = 2,000; Maximum Jetpacks = 4,000
- OC of 1 Car =
- OC of 1 Jetpack =
Now, watch a short video that demonstrates this "other goes over" method and uses it to determine comparative advantage.
Comparative Advantage, Terms of Trade, and Gains from Trade
The video "Comparative Advantage, Terms of Trade, and Gains from Trade" provides a very practical, exam-oriented method for these calculations.
Watch the segment explaining the "other goes over" method for calculating per-unit opportunity cost. Continue with the next section, which shows how to use these opportunity costs to determine comparative advantage.
The PPF and Opportunity Cost
The opportunity cost has a direct graphical representation: it is the absolute value of the slope of the Production Possibility Frontier (PPF). Since the Ricardian model assumes constant productivity, the PPF is a straight line. A country with a flatter PPF has a lower opportunity cost of producing the good on the horizontal axis.

Let's use this graph to determine comparative advantage.
- For the U.S.: It can produce a maximum of 24 units of cheese () or 12 units of wine ().
- The opportunity cost of 1 unit of cheese is units of wine.
- The opportunity cost of 1 unit of wine is units of cheese.
- For France: It can produce a maximum of 4 units of cheese or 8 units of wine.
- The opportunity cost of 1 unit of cheese is units of wine.
- The opportunity cost of 1 unit of wine is units of cheese.
By comparing these, we can conclude:
- Cheese: The U.S. has a lower opportunity cost (0.5 wine < 2 wine). Therefore, the U.S. has a comparative advantage in cheese.
- Wine: France has a lower opportunity cost (0.5 cheese < 2 cheese). Therefore, France has a comparative advantage in wine.
Note that if one country has a comparative advantage in one good, the other country must have a comparative advantage in the other good.
A Comprehensive Worked Example
Let's consolidate this process with a full numerical example. We will use the data and step-by-step calculations from the Ricardian One-Factor Model slides.
[PDF] 1.4 — Ricardian One-Factor Model - ECON 324 • International Trade
This walks through a complete problem from start to finish.
Follow the slides from the example. The example provides unit labor requirements for two countries (Home and Foreign) and two goods (x and y). Pay close attention to how the analysis proceeds: The PPF equations are derived for each country. Absolute advantage is identified by comparing the unit labor requirements directly. Opportunity costs (autarky relative prices) are calculated for each good in each country. These opportunity costs are compared to determine who has the comparative advantage in each good.
Practice Problem
Now it's your turn. Use the principles we've covered to solve the following problem.
There are two countries, Home and Foreign, producing wheat and cars. The unit labor requirements for each are given in the table below. Home has a total labor force of 20 workers, and Foreign has 30 workers.
| Unit Labor Req. for Cheese () | Unit Labor Req. for Wine () | |
|---|---|---|
| Home | 1 | 4 |
| Foreign | 2 | 5 |
Your task:
- Calculate the opportunity cost of cheese in terms of wine for both Home and Foreign.
- Calculate the opportunity cost of wine in terms of cheese for both Home and Foreign.
- Based on your calculations, which country has a comparative advantage in cheese?
- Which country has a comparative advantage in wine?
Take your time to work through the calculations.
Click for the solution
1. Opportunity Cost of Cheese:
- Home: units of wine.
- Foreign: units of wine.
2. Opportunity Cost of Wine:
- Home: units of cheese.
- Foreign: units of cheese.
3. Comparative Advantage in Cheese:
- Comparing the opportunity cost of cheese: Home's OC (0.25) is lower than Foreign's OC (0.4).
- Therefore, Home has a comparative advantage in cheese.
4. Comparative Advantage in Wine:
- Comparing the opportunity cost of wine: Foreign's OC (2.5) is lower than Home's OC (4).
- Therefore, Foreign has a comparative advantage in wine.
Conclusion
In this lesson, we have laid the quantitative foundation for understanding international trade. You learned how to use the Ricardian model to calculate opportunity costs and determine the pattern of comparative advantage, which is the engine of gains from trade.
Key Takeaways:
- Absolute advantage means being more productive in absolute terms, while comparative advantage means having a lower opportunity cost.
- Trade is based on comparative, not absolute, advantage.
- The opportunity cost of producing good X can be calculated as the ratio of labor requirements () or as the ratio of maximum possible outputs (Max Y / Max X).
- Graphically, the opportunity cost is the slope of the PPF. The country with the flatter PPF has a comparative advantage in the good on the horizontal axis.
Now that we know how to determine which country should specialize in which good, our next lesson will address the logical follow-up: how to calculate the gains that arise from this specialization and trade, and how to determine the range of trading prices (terms of trade) that will be mutually beneficial.