Hello! Welcome to the third lesson in our module on the mathematical foundations of quantitative finance.
In the last lesson, we saw how to represent financial data like asset quantities and prices as 1D vectors, and we used vector operations like the dot product to perform efficient portfolio calculations. This was a great start, but it's limited to analyzing one set of data at a time.
Today, we'll expand our toolkit to handle more complex, multi-dimensional data. This lesson addresses the learning outcome: Use NumPy to perform matrix operations, including multiplication, transposition, and inversion. We'll see how stacking vectors into a matrix (a 2D array) allows us to analyze multiple assets over multiple time periods, or even manage multiple portfolios at once. As a software developer, you'll find that these matrix operations are the building blocks for countless financial models and algorithms.
1. From Vectors to Matrices
A matrix is simply a rectangular grid of numbers, or a collection of vectors of the same size stacked together. In finance, matrices are incredibly useful for organizing data:
- A matrix could hold the daily prices of 500 stocks (rows) over the last 252 trading days (columns).
- It could represent the holdings of 10 different client portfolios (rows) across 30 assets (columns).
We create matrices in NumPy by creating a 2D array, typically from a list of lists.
import numpy as np

# A matrix of prices for 3 stocks over 2 days
# Each inner list is a row (one stock's price history)
prices = np.array([
    [170.0, 172.5],  # Stock A prices
    [300.0, 298.0],  # Stock B prices
    [450.0, 455.0]   # Stock C prices
])

print("Shape of prices matrix:", prices.shape)
# Output: Shape of prices matrix: (3, 2) -> 3 rows, 2 columns
This matrix structure allows us to perform operations across all our data simultaneously, leveraging the power of vectorization we discussed previously.
2. Matrix Transposition
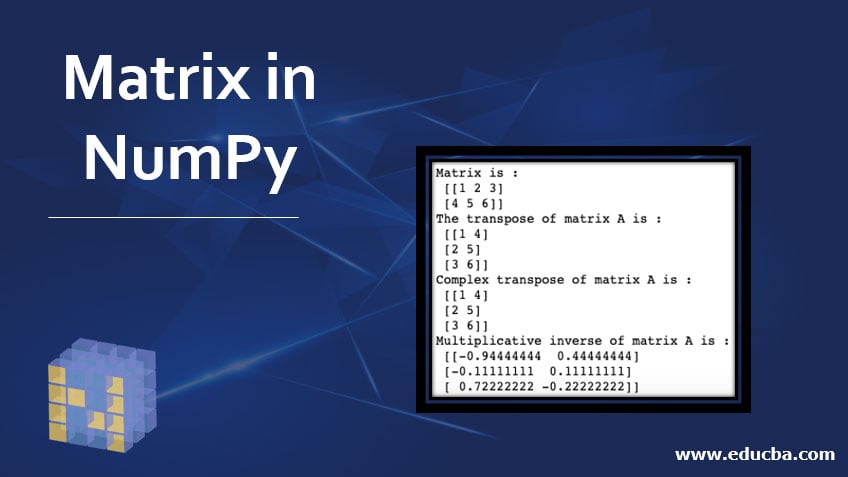
The transpose of a matrix is an operation that flips the matrix over its diagonal, switching the row and column indices. An matrix becomes an matrix. This is a fundamental operation in linear algebra, often used to make vectors and matrices conform to the rules of multiplication.
In NumPy, you can transpose a matrix using either the np.transpose() function or the more convenient .T attribute.
The following article, 'Introduction to NumPy', demonstrates the transpose operation clearly and provides context for why we use it in financial calculations.
Read the section titled 'The transpose of an array...'. It starts after the large covariance matrix example. This short section will show you the syntax and explain how transposing a 1D vector effectively turns it from a row into a column, which is crucial for matrix equations.
Here is a code example to illustrate the concept:
# Our (3, 2) prices matrix from before
prices = np.array([
    [170.0, 172.5],
    [300.0, 298.0],
    [450.0, 455.0]
])

# Transpose it
prices_transposed = prices.T

print("Original shape:", prices.shape)
print("Transposed shape:", prices_transposed.shape)
print("\nTransposed Matrix:\n", prices_transposed)

# Now each row represents a day, and each column a stock.
# [[170.  300.  450. ]  <- Day 1 prices for all stocks
#  [172.5 298.  455. ]] <- Day 2 prices for all stocks
3. Matrix Multiplication: The @ Operator
Matrix multiplication is one of the most important operations in linear algebra. Unlike element-wise multiplication (*), it combines rows from the first matrix with columns from the second matrix.
The Golden Rule: To multiply two matrices, A @ B, the number of columns in matrix A must equal the number of rows in matrix B. If A is (m, n) and B is (n, p), the resulting matrix will be (m, p).
While NumPy has functions like np.dot() and np.matmul(), the modern, preferred syntax introduced in Python 3.5 is the @ operator. It's not just cleaner—it makes complex mathematical formulas significantly more readable, a quality highly valued in professional code.
Python's @ Operator: The Key to Better Readability in Matrix Operations
This video is perfect for your background. It explains not just how to perform matrix multiplication, but why the @ operator is a superior choice for writing clean, readable code—a key concern for any developer.
Watch from timestamp 04:11 to the end (06:50). Pay close attention to the comparison between code using np.matmul() and code using the @ operator. This highlights the practical benefit of using @ in a real-world algorithm.
Let's apply this. Imagine we have two portfolios with different quantities of the same 3 stocks. We can represent this as a (2, 3) matrix. We can then use matrix multiplication with a (3, 1) vector of prices to calculate the total value of each portfolio in a single operation.
# Quantities for two portfolios (2 rows, 3 columns)
quantities = np.array([
    [10, 5, 20],   # Portfolio 1
    [0, 50, 15]    # Portfolio 2
])

# Prices for the three stocks (as a 3x1 column vector)
prices = np.array([
    [170],
    [300],
    [450]
])

# Check dimensions: (2, 3) @ (3, 1) -> (2, 1)
# This is valid!
portfolio_values = quantities @ prices

print("Quantities matrix shape:", quantities.shape)
print("Prices vector shape:", prices.shape)
print("Resulting values shape:", portfolio_values.shape)
print("\nTotal value of each portfolio:\n", portfolio_values)
# [[12200]  <- Value of Portfolio 1
#  [21750]] <- Value of Portfolio 2
4. Matrix Inversion
In regular arithmetic, dividing by a number x is the same as multiplying by its reciprocal 1/x. The inverse of a matrix is a similar concept. The inverse of a square matrix A, denoted as , is the matrix that, when multiplied by A, yields the identity matrix I (a matrix with 1s on the diagonal and 0s elsewhere).
Matrix inversion is crucial for solving systems of linear equations, a common task in finance (e.g., in portfolio optimization).
Key Constraints:
- Only square matrices (where
m = n) can have an inverse. - Not all square matrices have an inverse. A matrix without an inverse is called singular. This happens if the matrix's rows or columns are not linearly independent (e.g., one row is a multiple of another).
Linear Algebra - Introduction To Financial Python
This article from QuantConnect provides a concise and practical explanation of matrix inversion.
Read the section titled 'Inverse'. It clearly defines the identity matrix, explains the concept of an inverse, and shows how to use np.linalg.inv(). Importantly, it also shows what happens when you try to invert a singular matrix, which is a common error to watch for.
Here's how you perform an inversion in NumPy:
# A simple 2x2 square matrix
A = np.array([
    [4, 7],
    [2, 6]
])

# Calculate the inverse
A_inv = np.linalg.inv(A)

print("Inverse of A:\n", A_inv)

# Verify by multiplying A by its inverse
# The result should be the 2x2 identity matrix
identity = A @ A_inv

# np.round is used to clean up tiny floating point errors
print("\nA @ A_inv:\n", np.round(identity))
# [[ 1.  0.]
#  [ 0.  1.]]
Test your understanding!
A core calculation in modern portfolio theory is finding the portfolio variance, given by the formula , where:
- is a column vector of asset weights.
- (Sigma) is the covariance matrix of asset returns.
- is the transpose of the weights vector.
You are given the following:
- A covariance matrix for two assets.
- A weights vector for a portfolio containing these two assets.
import numpy as np

# Covariance matrix (2x2)
Sigma = np.array([
    [0.04, 0.018],
    [0.018, 0.09]
])

# Portfolio weights (as a 1D array/row vector)
weights_row = np.array([0.5, 0.5])
Your task is to calculate the portfolio variance using matrix operations.
Instructions:
- The weights are given as a 1D array, which NumPy treats as a row vector
(1, 2). The formula requires as a column vector(2, 1)and as a row vector. How can you get these shapes fromweights_row? (Hint:reshapeand.T). - Using the
@operator, compute the portfolio variance . The result should be a single scalar value.
Show answer
import numpy as np

# Given data
Sigma = np.array([
    [0.04, 0.018],
    [0.018, 0.09]
])
weights_row = np.array([0.5, 0.5])

# 1. Reshape the weights vector to be a column vector (2, 1)
weights_col = weights_row.reshape(2, 1)
# The transpose will then be a row vector (1, 2)
weights_transpose = weights_col.T

# You can also use weights_row directly for the transpose part,
# as it already has the correct shape for w^T.

# 2. Calculate variance: (1, 2) @ (2, 2) @ (2, 1) -> (1, 1)
# First part: w^T @ Sigma
part1 = weights_transpose @ Sigma
# Second part: (w^T @ Sigma) @ w
variance = part1 @ weights_col

# The result is a 1x1 matrix, so we extract the scalar value
portfolio_variance = variance[0, 0]

print(f"Weights (column vector):\n{weights_col}\n")
print(f"Portfolio Variance (σ²): {portfolio_variance:.4f}")

# The one-line version is very common in quant code:
# variance_oneline = weights_row @ Sigma @ weights_row
# Note: NumPy is smart about handling the 1D array in this specific case.
# But being explicit with shapes (as done above) is better practice.
The output should be:
Weights (column vector):
[[0.5]
 [0.5]]

Portfolio Variance (σ²): 0.0415
This calculation demonstrates how transpose and matrix multiplication are combined to execute a key financial formula.
Conclusion
You've now mastered the fundamental matrix operations that form the bedrock of computational finance. These are not just abstract mathematical ideas; they are the tools you will use daily to build, test, and run quantitative models efficiently.
Key Takeaways:
- Matrices (2D NumPy arrays) are used to organize complex datasets, such as the prices of many assets over time.
- Transposition (
.T) is a simple but essential operation for reorienting matrices to meet the requirements of linear algebra formulas. - Matrix Multiplication (
@) is the key to combining different sets of data, such as portfolio quantities and asset prices. Its dimension rule ((m, n) @ (n, p) -> (m, p)) is critical to remember. - Matrix Inversion (
np.linalg.inv) is the matrix equivalent of division and is used to solve systems of linear equations, a core task in optimization problems.
Preview of the Next Lesson:
You've already had a sneak peek! We've assembled all the necessary mathematical machinery with vectors and matrices. In the next lesson, "Calculate portfolio returns and volatility using vector and matrix algebra," we will fully formalize the portfolio variance calculation you just practiced and also compute portfolio returns, applying today's operations to solve a concrete and essential finance problem.