Introduction
Welcome back! In the last lesson, you did the critical work of defining a Minimum Viable Product (MVP) scope for your chosen project. You now have a clear "what": a single problem statement, a core job-to-be-done, and a measurable success metric, all constrained to a "thin slice" of functionality that you can build in a short time.
This lesson focuses on the "how." Your learning outcome is to sketch a block diagram of the end-to-end data and model pipeline for your MVP. This is the bridge between your project idea and the code you'll start writing in the next module. Creating this diagram forces you to think through the entire process step-by-step, from raw data to final output, ensuring all the pieces connect logically before you get lost in implementation details.
What is a Machine Learning Pipeline?
At its core, an ML pipeline is an automated sequence of steps that takes raw data, processes it, trains or applies a model, and produces a result. It's the assembly line for your AI-powered tool. The concept of a sequential data transformation pipeline will likely be familiar from your work with data analysis libraries like Pandas.
To establish a solid foundation, let's look at a formal definition and the typical components of a pipeline.
A full guide to building your Machine Learning pipeline
This article from Coaxsoft provides an excellent overview of what an ML pipeline is and its fundamental components.
Please read the introduction ('What is ML pipeline?') and the section 'Key components of an end-to-end ML pipeline'. Focus on the three essential steps identified by IBM: data assembly, model development, and model deployment.
As the article describes, a pipeline is about creating a structured, automated, and repeatable workflow. For your MVP, this might seem like overkill, but establishing this mindset from the start is crucial for building a tool that can eventually move from a simple script to a production-ready system.
A well-structured diagram visually represents this workflow. Here is a great example of a generic, end-to-end ML pipeline.

From General Concepts to Specific Blocks
The generic pipeline diagram is a great starting point, but for your project, we need to be more specific. Your work will involve Mining Software Repositories (MSR), which has its own well-defined process that maps perfectly onto a pipeline structure.
We can break down your MVP pipeline into a series of functional blocks:
- Data Ingestion: The starting point. This is the raw data your tool will consume (e.g., a path to a Git repository, a directory of log files, a single source file).
- Data Extraction/Parsing: Reading and parsing the raw data into a structured format. This might involve using a library like
GitPythonto read commit history or an XML parser for test results. - Data Cleaning: Filtering out noise. As discussed in research on MSR, this could mean ignoring merge commits, bot-generated changes, or commits that only fix typos.
- Processing/Feature Engineering: Transforming the clean data into the inputs needed for your model or heuristic. This is where you'll calculate metrics like code churn, cyclomatic complexity, or test pass/fail ratios. For an LLM-based tool, this step would be Prompt Construction.
- Model Application/Heuristic: Applying your logic. In the MVP, this is likely a simple heuristic (e.g.,
if failure_rate > 0.5) or a single API call to an LLM. - Output Generation: Formatting the results from the model into a human-readable output, such as a ranked list or a block of generated code.
- Presentation: Displaying the final output to the user, likely by printing it to the command line.
This sequence of steps forms the blueprint for your tool.
Example Pipelines for Your Project Ideas
Let's make this concrete by sketching the pipelines for the three MVP examples from the previous lesson.
1. FlakeFinder CLI
- Core Functionality: Ingest test reports, analyze pass/fail history, and output a list of flaky tests.
The pipeline would look like this:
[Directory of JUnit XMLs] -> Parse XML Files -> [List of Test Results (test_name, outcome, timestamp)] -> Aggregate History per Test -> [Dictionary {test_name: [history]}] -> Apply Flakiness Heuristic -> [List of Flaky Test Names] -> Print to CLI
2. TestGenie (Automated Test Case Generation)
- Core Functionality: Take a function's location, call an LLM, and print a generated test case.
The pipeline for this is very linear and showcases how LLMs fit into this structure. The diagram below illustrates a similar architecture.
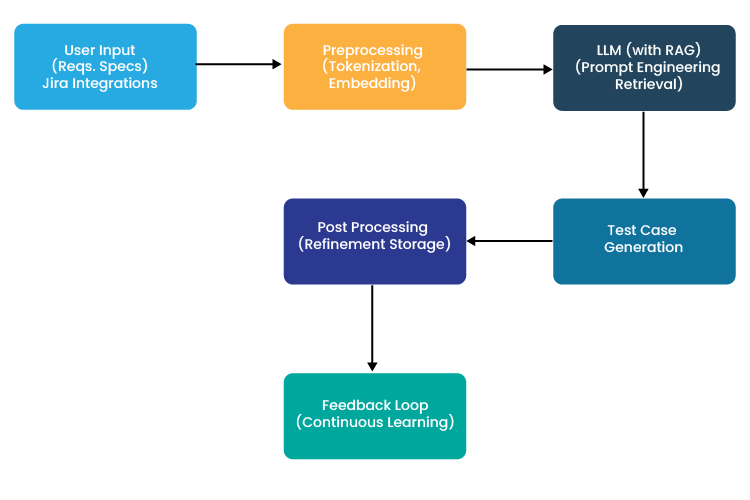
Your specific MVP pipeline would be:
[File Path + Function Name] -> Extract Function Source Code -> [String of Source Code] -> Construct LLM Prompt -> [Formatted Prompt String] -> Call LLM API -> [LLM API Response] -> Extract & Clean Code Block -> [String of Python Test Code] -> Print to CLI
3. DebtRanker CLI
- Core Functionality: Scan a Git repo, calculate a debt score for each file, and print a ranked list.
This pipeline involves combining data from two different sources (Git history and static code analysis).
[Path to Git Repo] -> (Branching paths)
Extract Commit History (GitPython)->Calculate Churn per File-> [Dict {file: churn_score}]Find all .py Files->Calculate Complexity per File (radon)-> [Dict {file: complexity_score}]
(Paths converge) -> Combine Scores with Heuristic -> [Dict {file: final_debt_score}] -> Rank Files by Score -> [Ranked List of (File, Score) Tuples] -> Print to CLI
Your Task: Sketch Your MVP Pipeline
Now it's your turn. Take the MVP scope you defined in the previous lesson and translate it into a block diagram. This is your architectural blueprint.
Instructions:
- Start with the input: What is the very first piece of data your tool needs? (e.g., a file path). This is your first block on the far left.
- End with the output: What is the final thing the user sees? (e.g., a list printed to the console). This is your last block on the far right.
- Fill in the middle: Add boxes for each distinct processing step (e.g., "Parse Files", "Calculate Metrics", "Apply Heuristic"). Use a "Verb-Noun" format for clarity.
- Connect with arrows: Draw arrows between the boxes to show the flow of data.
- Label the data: On each arrow, briefly describe the data being passed from one step to the next (e.g., "List of commits", "JSON response").
You can use any tool you like for this: a simple online tool like Excalidraw or diagrams.net, or even just sketch it on paper and take a photo. The goal is clarity and completeness, not artistic skill.
Your diagram should be a visual representation of the Core Functionality you defined in your MVP scope.
Conclusion
In this lesson, you've learned how to translate your project's "what" into a concrete "how" by sketching an end-to-end pipeline. This process moves you from a high-level idea to a tangible, technical plan.
Key Takeaways:
- An ML pipeline is a sequence of automated steps that transforms raw data into a valuable output.
- A block diagram is an essential tool for designing your pipeline, forcing you to think about data flow and the responsibility of each component.
- Your MVP pipeline can be broken down into key stages: Ingestion -> Extraction -> Cleaning -> Processing -> Model/Heuristic -> Output -> Presentation.
Preview of the Next Lesson:
With your architectural blueprint in hand, you're ready to start building! The next lesson, "Create a script to fetch and version the primary raw data source for your chosen project," is the first step in turning your diagram into reality. You will write the code for the very first block in your pipeline, kicking off the implementation phase of your project.