Hello! Let's continue building your R programming skills.
Introduction
In our last lesson, you learned how to construct R's primary data structures—vectors, lists, and most importantly, data frames—from scratch. While this is essential for understanding how R organizes information, in your day-to-day work as a researcher, you will rarely type out your data by hand. Your data will already exist in files, perhaps exported from a lab instrument, a patient database, or shared by a collaborator.
This lesson focuses on the crucial next step: bringing that external data into your R environment. You will learn how to import data from CSV, Excel, and SPSS files. These are three of the most common formats you'll encounter in clinical and academic research. We'll use a suite of powerful packages from the Tidyverse—readr, readxl, and haven—to make this process smooth and reliable. Mastering data import is the gateway to analyzing real-world datasets.
1. The Universal Standard: Importing CSV Files with readr
The simplest and most robust format for storing rectangular data is the Comma-Separated Values (.csv) file. A CSV is a plain text file where columns are separated by commas and rows are separated by new lines. Because of its simplicity, it can be opened by almost any data analysis software, making it a universal standard for sharing data.
The readr package, part of the core tidyverse, is R's primary tool for reading plain text data files. Its main function for this task is read_csv().
Let's see how it works.
Chapter 5 Importing Your Data into R
This reading from "R for Medical Data" introduces the readr package and demonstrates how to import a CSV file directly from a web URL. This is a common and convenient workflow.
Please read from the start of Section 5.1, Reading with {readr}. Pay close attention to the example where the scurvy.csv file is imported. Notice the two key steps: first, the data is read and displayed, and second, it's assigned to a variable (scurvy_data <- ...) so you can work with it.
As you saw in the reading, the basic syntax is straightforward: my_data <- read_csv("path/to/your/file.csv").
A Helping Hand: RStudio's Import GUI
RStudio provides a helpful graphical user interface (GUI) for importing data, which is great for learning because it shows you the code it's generating. In the "Environment" pane (top-right), you can click "Import Dataset" -> "From Text (readr)...".

Handling Messy CSV Files
Real-world data is often messy. You might receive files with introductory text before the actual data starts, or files without proper column headers. read_csv() has arguments to handle this. Two of the most common are:
skip = n: Tells R to skip the firstnlines of the file.col_names = FALSE: Tells R that the first row is not a header, but actual data. R will then assign default names (X1,X2, etc.).
Chapter 5 Importing Your Data into R
This section of the same reading demonstrates how to use col_names and skip to correctly import a file where you either want to provide your own column names or need to bypass initial rows of text.
Read the part of the chapter that begins just after the "Test yourself on scurvy" box, from the paragraph about col_names and skip. This illustrates how to solve common import problems.
2. The Ubiquitous Spreadsheet: Importing Excel Files with readxl
In clinical settings, it's extremely common for data to be collected and stored in Microsoft Excel spreadsheets (.xls or .xlsx). While Excel is a flexible tool, this flexibility can lead to data that is difficult to import programmatically. You might find merged cells, multiple tables on one sheet, titles and notes mixed in with data, or data spread across multiple sheets.
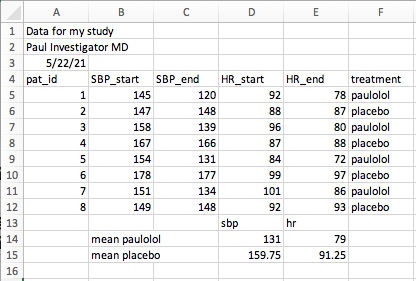
The readxl package is designed to handle these challenges. It reads Excel files directly without any external dependencies like Java, making it highly reliable.
This video from CradleToGraveR explains why readxl is the preferred package and gives a clear demonstration of its basic use.
First, watch the brief explanation of why use readxl over other packages. Then, watch the main demonstration which shows how to install and load the package and how to read a sheet from an Excel file using the read_excel() function and its sheet argument.
As the video showed, the key function is read_excel(). Its most important arguments for cleaning up messy files are:
sheet = "SheetName"orsheet = 2: Specifies which sheet to read, either by its name or its position. By default, it only reads the first one.skip = n: Just like withread_csv(), this skips the firstnrows. This is essential for files like the one pictured above.n_max = n: Tells R to read onlynrows of data after skipping. This is useful for ignoring summary rows at the bottom of a sheet.
Let's see how these arguments can be used to import the messy paulolol.xlsx file.
Chapter 5 Importing Your Data into R
This reading provides a practical example of importing a messy Excel file, perfectly illustrating the problems you're likely to face.
Please read Section 5.2, Reading Excel Files. Follow the author's thought process as they first attempt to import the file, diagnose the problems (extra headers, summary rows), and then use the skip and n_max arguments to solve them.
3. Collaborating with Colleagues: Importing SPSS Files with haven
SPSS is a statistical software package that has been a mainstay in medical, social, and health sciences for decades. It is highly probable that you will need to work with data from collaborators who use SPSS. These files typically have a .sav extension.
The haven package is the Tidyverse solution for importing data from other statistical packages, including SPSS, Stata, and SAS. A major advantage of haven is that it preserves valuable metadata. For example, SPSS uses "value labels" (e.g., the number 1 might be labeled as "Male" and 2 as "Female"). haven imports these as a special type of vector that retains both the number and the label, which is incredibly useful.
This video from Research Tips provides a very clear, step-by-step guide on how to import an SPSS file into RStudio.
Watch this short video to see the entire process. Starting around 36 seconds, it covers installing haven, and then demonstrates how to import a file using both the RStudio menu and the corresponding R code. Notice the data preview window, which is similar to the one for readr.
The function for importing SPSS files is haven::read_sav(). As with the other import functions, you simply provide the path to the file.
# First, you might need to install the package if you haven't already
# install.packages("haven")


# Then, load it and use the function
library(haven)
my_spss_data <- read_sav("path/to/your/file.sav")
The haven package is a bridge that allows you, an R user, to seamlessly collaborate with colleagues using other statistical software, a vital skill for interdisciplinary research.
Let's Practice
It's time to apply these skills. In your clinical-trial-practice RStudio Project:
- Create a new R Script file and save it as
02-data-import.R. - At the top of the script, add comments with your name and the date, and a title for the script.
- Install necessary packages. If you have already installed the
tidyversepackage, you havereadrandreadxl. You may still needhaven. Add this code to your script and run it. It's okay to runinstall.packages()on a package you already have.# Install packages if needed install.packages("tidyverse") # Includes readr and readxl install.packages("haven") # Load the packages for this session library(tidyverse) library(haven) - Task 1: Import a CSV file. The
palmerpenguinsdataset is a modern alternative to the classicirisdataset. Import it directly from its URL.# Task 1: Import penguins data from a CSV URL penguins_url <- "https://raw.githubusercontent.com/allisonhorst/palmerpenguins/main/inst/extdata/penguins.csv" penguins_data <- read_csv(penguins_url) # Inspect the first few lines print(penguins_data) - Task 2: Import from a messy Excel file. Using the
paulolol.xlsxfile from our lesson, import only the clean, rectangular patient data. You will need to use theskipandn_maxarguments correctly.# Task 2: Import from a messy Excel file clinical_url <- "https://github.com/higgi13425/rmrwr-book/raw/master/data/paulolol.xlsx" clinical_data <- read_excel(clinical_url, skip = 3, n_max = 8) # Hint: Check the lesson for the right numbers! # Inspect the imported data print(clinical_data) - Task 3: Import an SPSS file. This dataset is from a historical clinical trial on the use of streptomycin for tuberculosis. Import it from its URL.
# Task 3: Import an SPSS data file
tb_url <- "https://raw.githubusercontent.com/higgi13425/rmrwr-book/master/data/strep_tb.sav"
tb_data <- read_sav(tb_url)


# Inspect the imported data
print(tb_data)
Run each chunk of code in your script. In your Environment pane, you should now see three new data frames: penguins_data, clinical_data, and tb_data.
Conclusion
You have just acquired a fundamental skill for any data analyst: getting data into your workspace. You've seen that while the goal is always to have a clean, rectangular data frame, the path to get there requires knowing the right tools and their options.
Key Takeaways:
readr::read_csv(): The standard for importing data from.csvfiles. It's fast, reliable, and forms the foundation of data import.readxl::read_excel(): Your tool for the inevitable task of reading data from Excel files. Itssheet,skip, andn_maxarguments are essential for taming messy spreadsheets.haven::read_sav(): The bridge to collaborating with colleagues using SPSS (and other statistical packages). It handles specific metadata like value labels gracefully.- Problem-Solving: Data import is often the first step in data cleaning. Learning to use function arguments to solve import issues is a critical skill.
Preview of the Next Lesson:
Now that you have successfully imported several datasets into R, what's next? Before you can analyze or visualize data, you must first understand its structure. In our next lesson, you will learn how to examine the structure of a data frame using str(), glimpse(), and summary(). These functions will become your go-to tools for the initial exploration of any new dataset you encounter.