Hello! In our last lesson, we explored the power of ANOVA for comparing means across multiple groups. We also touched upon a critical aspect of any statistical test: its assumptions. Specifically, ANOVA, like the t-test, works best when your data meets certain conditions, such as being normally distributed. This raises an important practical question for any researcher: What do you do when your data doesn't play by the rules?
This lesson provides the answer by introducing you to the world of non-parametric tests. These are robust alternatives to the parametric tests you've learned, designed to work even when assumptions about data distribution are not met. We will cover the non-parametric equivalents for the main tests in your toolkit:
- Wilcoxon tests: The alternatives to the t-test for comparing two groups.
- Kruskal-Wallis test: The alternative to the one-way ANOVA for comparing three or more groups.
- Fisher's exact test: An alternative to the chi-square test, especially useful for small datasets.
By the end of this lesson, you will be equipped to choose and apply the correct statistical test for a much wider range of real-world data scenarios, a crucial skill for producing reliable clinical research.
1. The "Why" and "When" of Non-Parametric Tests
Parametric tests like the t-test and ANOVA are powerful, but their power comes from making assumptions about the data's distribution—most famously, that the data (or more accurately, the errors) are normally distributed. Non-parametric tests, also known as "distribution-free" tests, make fewer assumptions. They typically operate on the ranks of the data rather than the actual values.
For example, instead of comparing the mean blood pressure between two groups, a non-parametric test might rank all participants' blood pressure from lowest to highest and then check whether one group has systematically lower or higher ranks than the other. This makes them less sensitive to outliers and skewed distributions.
This short video provides an excellent overview of the rationale behind using non-parametric tests.
Non-parametric tests in R (Sign Test/Wilcoxon, Mann Whitney U, Kruskal Wallis, Spearman)
This video, "Non-parametric tests in R," provides a concise and clear introduction to the topic.
Please watch the first part, which explains the main reasons for using non-parametric tests (the introduction). Pay attention to the four key scenarios the presenter outlines: When normality assumptions are not met (skewed data). When you have a small sample size. When there are significant outliers. When your data is ordinal (e.g., pain scores from "mild" to "severe").
2. Comparing Two Groups: The Wilcoxon Test Family
When the assumptions for a t-test are violated, your go-to alternative is the Wilcoxon test. It comes in two main flavors, corresponding to the independent and paired t-tests. The R function for both is wilcox.test().
Independent Samples: Wilcoxon Rank-Sum Test
The Wilcoxon rank-sum test, also known as the Mann-Whitney U test, is the non-parametric equivalent of the independent two-sample t-test. It tests whether two independent groups come from the same distribution.
Let's see how to perform this test in R.
# Let's imagine a small clinical dataset where we compare the
# response to a treatment in two groups, A and B.
# The data is not normally distributed.

group_a <- c(12, 18, 11, 14, 25, 30)
group_b <- c(22, 28, 35, 31, 29, 40)


# Perform the Wilcoxon Rank-Sum test
wilcox.test(group_a, group_b)


##  Wilcoxon rank sum test
##
## data:  group_a and group_b
## W = 3, p-value = 0.015
## alternative hypothesis: true location shift is not equal to 0
The small p-value (0.015) suggests a significant difference between the two groups. Just as with other test objects, we can use broom::tidy() to get a clean data frame.
# Create a data frame first for a more tidy approach
treatment_data <- data.frame(
  response = c(group_a, group_b),
  group = rep(c("A", "B"), each = 6)
)


# Run the test using the formula syntax
test_result <- wilcox.test(response ~ group, data = treatment_data)


# Tidy the result
broom::tidy(test_result)


## # A tibble: 1 × 4
##   statistic p.value method                         alternative
##       <dbl>   <dbl> <chr>                          <chr>
## 1         3  0.0152 Wilcoxon rank sum exact test   two.sided
This tidy output is perfect for reports and programmatic access to the p-value. The following resource shows this exact workflow.
Data Science for Biological, Medical and Health Research: Notes for 431
This excerpt demonstrates performing the Wilcoxon rank-sum test and then tidying the output.
Please read section 21.3 Wilcoxon Rank Sum-based CI from Independent Samples to see the wilcox.test() function in action with its formula syntax. Then, review section 21.4 Using the tidy function to see how broom::tidy() is applied to the output of wilcox.test(), which is a key part of your desired workflow.
Paired Samples: Wilcoxon Signed-Rank Test
For paired data, such as "before and after" measurements on the same patients, the non-parametric alternative to the paired t-test is the Wilcoxon signed-rank test. It works by ranking the absolute differences between pairs and comparing the sums of the ranks for positive and negative differences.
In R, you use the same wilcox.test() function but with the paired = TRUE argument.
# Data from a hypothetical study measuring pain scores before and after a treatment
before_treatment <- c(8, 7, 9, 6, 8, 7)
after_treatment  <- c(4, 5, 5, 3, 6, 4)


# Perform the Wilcoxon Signed-Rank test
wilcox.test(before_treatment, after_treatment, paired = TRUE)


##  Wilcoxon signed rank exact test
##
## data:  before_treatment and after_treatment
## V = 21, p-value = 0.031
## alternative hypothesis: true location shift is not equal to 0
The p-value of 0.031 indicates a significant change in pain scores after the treatment.
3. Comparing More Than Two Groups: Kruskal-Wallis Test
As we previewed in the last lesson, when the assumptions of ANOVA are violated, you should use the Kruskal-Wallis test. It is the non-parametric equivalent of the one-way ANOVA and tests the null hypothesis that the medians of three or more groups are equal.
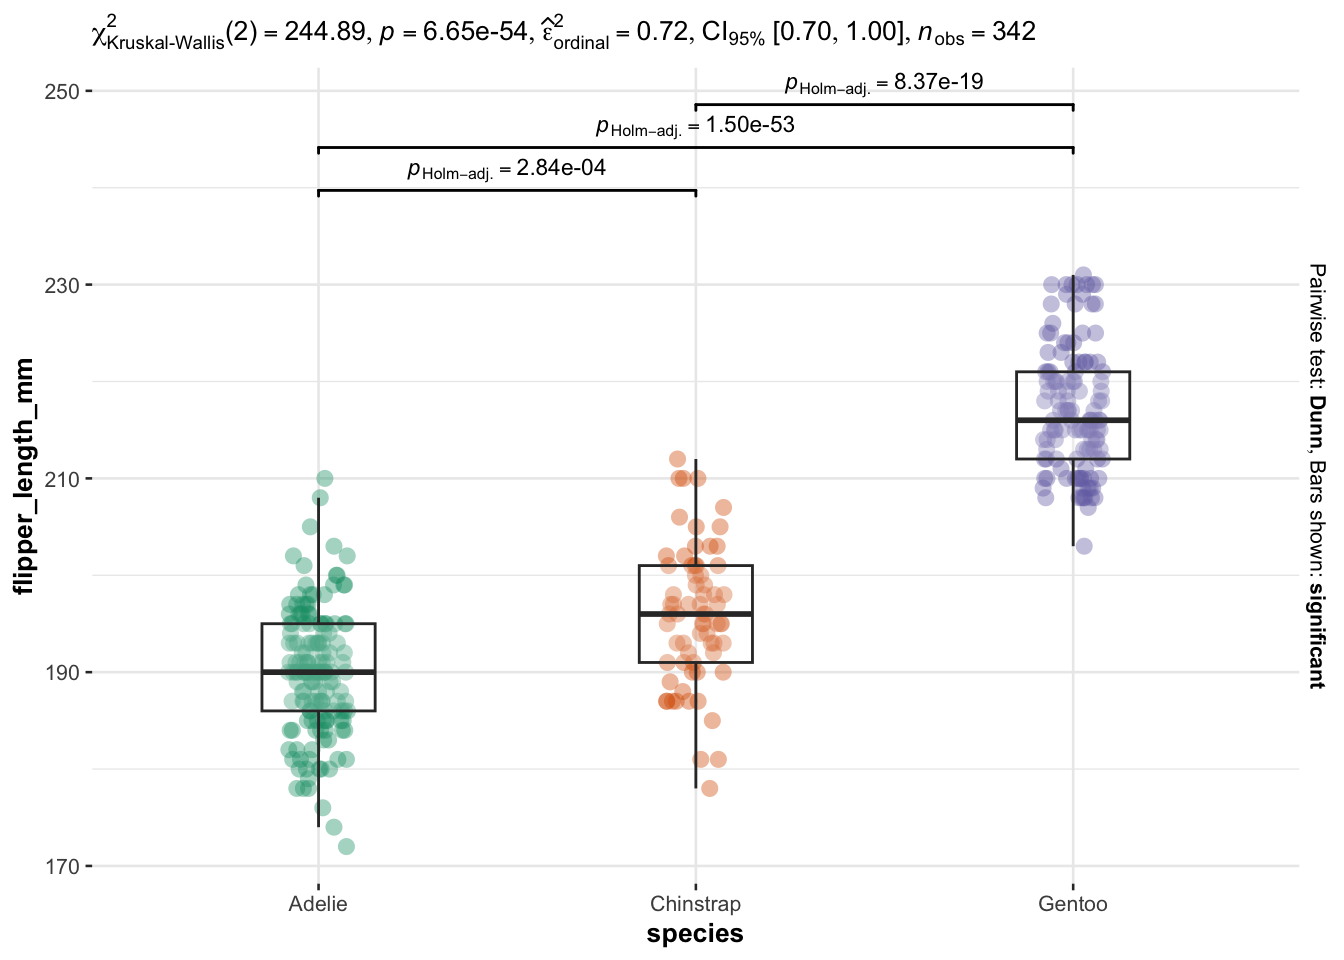
Just like ANOVA, if the Kruskal-Wallis test is significant, it tells you that at least one group is different, but it doesn't tell you which ones. Therefore, you must follow it up with post-hoc tests to conduct pairwise comparisons. A common choice for the Kruskal-Wallis test is the Dunn test.
The following blog post provides a comprehensive, step-by-step guide to performing a Kruskal-Wallis test, interpreting it, and running the Dunn post-hoc test.
Kruskal-Wallis test, or the nonparametric version of ...
This article from "Stats and R" walks through a full example using the penguins dataset.
Read the Introduction to understand the context. Jump to the section Aim and hypotheses to formalize the null and alternative hypotheses. Review the Assumptions. Note that while normality is not required, independence of observations is still crucial. Follow the example In R to see how to use the kruskal.test() function. Finally, and most importantly, read the sections on Post-hoc tests and the Dunn test. This shows how to identify which specific groups differ, which is often the main goal of the analysis.
The author of that post also highlights a wonderful package, {ggstatsplot}, which can run the tests and create a publication-ready plot in one go. The plot below is generated using that package and is a fantastic example of effective data visualization, as it includes the data distribution, the overall test statistic, and the results of the pairwise post-hoc comparisons.
4. Comparing Categorical Variables: Fisher's Exact Test
What if you have categorical data but your sample size is too small for a chi-square test? The chi-square test relies on having a sufficient number of expected observations in each cell of your contingency table (typically >5). When this assumption is not met, the appropriate alternative is Fisher's exact test.
Fisher's exact test calculates the exact probability of observing the table you have, or one more extreme, given the row and column totals. It's computationally more intensive than the chi-square test, but with modern computers, this is rarely an issue. It is the standard for 2x2 tables with small samples.
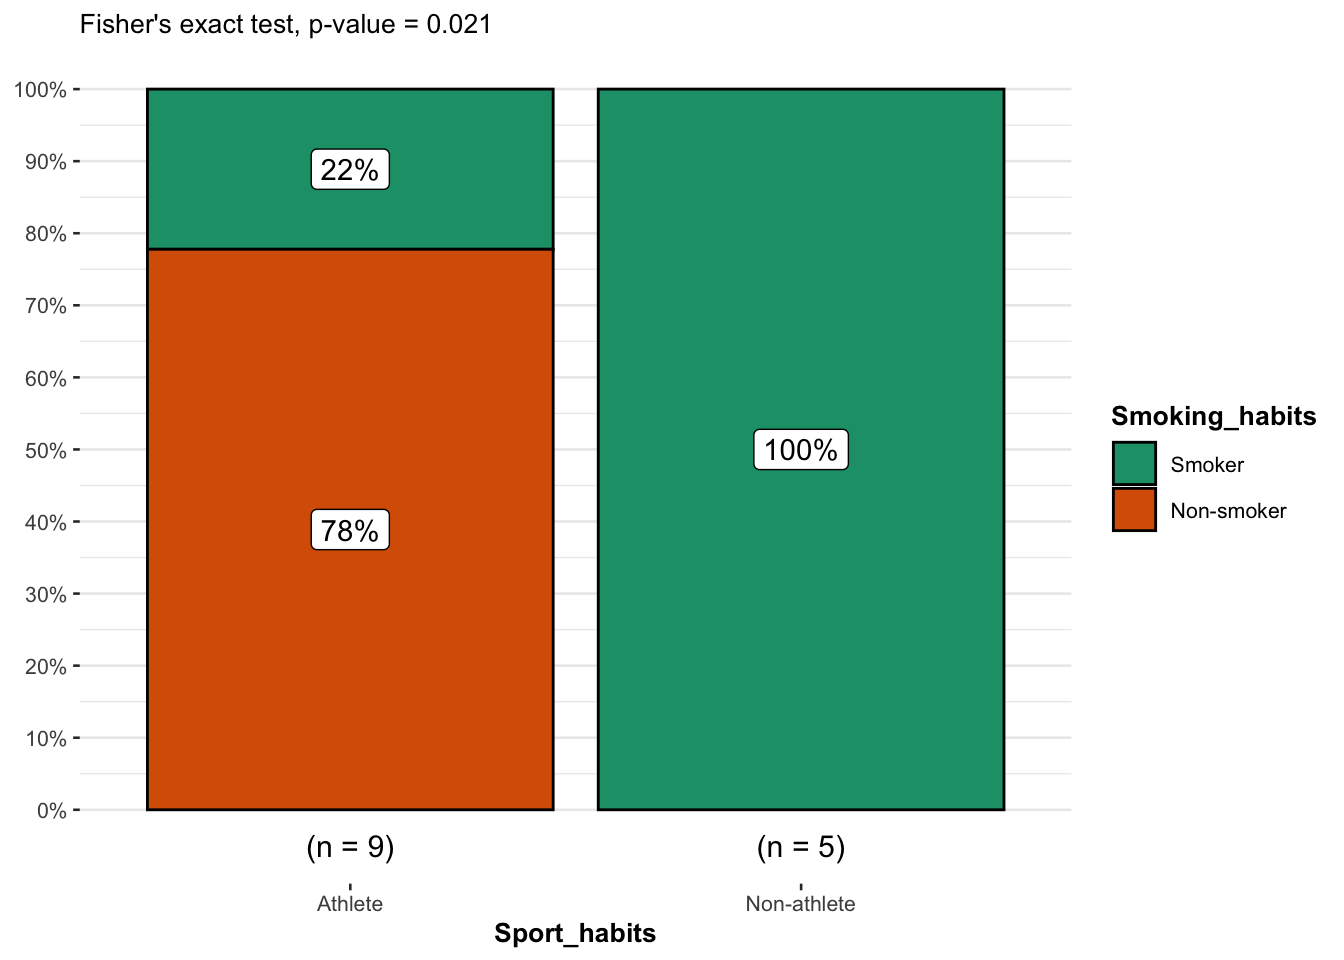
Consider the data shown in the plot below, comparing smoking habits between a small group of athletes and non-athletes.
Let's reconstruct this data and perform the test in R.
First, we create a contingency table (a matrix) representing the data.
- Athletes: 2 smokers, 7 non-smokers
- Non-athletes: 5 smokers, 0 non-smokers
# Create the 2x2 contingency table
smoking_data <- matrix(c(2, 5, 7, 0), nrow = 2,
                       dimnames = list(Habit = c("Smoker", "Non-smoker"),
                                       Sport = c("Athlete", "Non-athlete")))

print(smoking_data)


##            Sport
## Habit        Athlete Non-athlete
##   Smoker           2           5
##   Non-smoker       7           0


# Perform Fisher's Exact Test
fisher.test(smoking_data)
The R output gives us:
##  Fisher's Exact Test for Count Data
##
## data:  smoking_data
## p-value = 0.021
## alternative hypothesis: true odds ratio is not equal to 1
## ...
The p-value is 0.021, matching the value shown in the plot. We would reject the null hypothesis and conclude there is a significant association between athlete status and smoking habits in this sample.
Conclusion
You now have a robust set of non-parametric tools to handle situations where standard parametric tests are not appropriate. This flexibility is essential for conducting sound data analysis, as real-world data rarely comes in perfect, normally-distributed packages.
Key Takeaways:
- Non-parametric tests are "distribution-free" alternatives used when assumptions of parametric tests (like normality) are violated.
- They often work with the ranks of the data, making them robust to outliers and skewed distributions.
- Your new toolkit includes:
- Wilcoxon Rank-Sum Test (
wilcox.test): Alternative to the independent t-test. - Wilcoxon Signed-Rank Test (
wilcox.test(..., paired = TRUE)): Alternative to the paired t-test. - Kruskal-Wallis Test (
kruskal.test): Alternative to the one-way ANOVA. Requires post-hoc tests (like the Dunn test) to identify specific group differences. - Fisher's Exact Test (
fisher.test): Alternative to the chi-square test, especially for small sample sizes.
- Wilcoxon Rank-Sum Test (
- The
broom::tidy()function continues to be your friend, providing clean, tabular output for these tests as well.
Preview of the Next Lesson:
Throughout this module, you've seen how broom::tidy() can tame the output of various statistical tests. In our next lesson, we will focus exclusively on this powerful function. You will learn to systematically interpret the key columns it produces—estimate, p.value, conf.low, conf.high—across different models, solidifying your ability to extract and report statistical findings in a tidy, reproducible manner.