Introduction
Welcome to your first lesson on your journey to mastering Tableau! The goal of this course is to build your skills and confidence so you can use Tableau effectively in a professional role, such as a Business or Data Analyst.
Today, we'll start with the absolute fundamentals. This lesson addresses the learning outcome: Navigate the Tableau Desktop interface and identify key components (data pane, shelves, cards, toolbar).
Think of this as learning the layout of your workshop. Before you can build anything, you need to know where your tools and materials are. By the end of this lesson, you'll be able to identify the main parts of the Tableau workspace, understand their purpose, and feel comfortable navigating the environment. This foundational knowledge is crucial for every single visualization you will create in the future.
This lesson is quite comprehensive and might take you about an hour to complete. Feel free to split it into two shorter sessions if that better fits your 30-minute daily schedule.
Your Workspace: The Tableau Worksheet
After you open Tableau and connect to a data source (which we will cover in the next lesson), you'll spend most of your time in the worksheet. This is your primary canvas for building data visualizations, or "vizzes" as they are often called in Tableau.
Let's start with a visual map of the worksheet interface. The image below labels the key areas we will be discussing. Refer back to this as you go through the lesson.
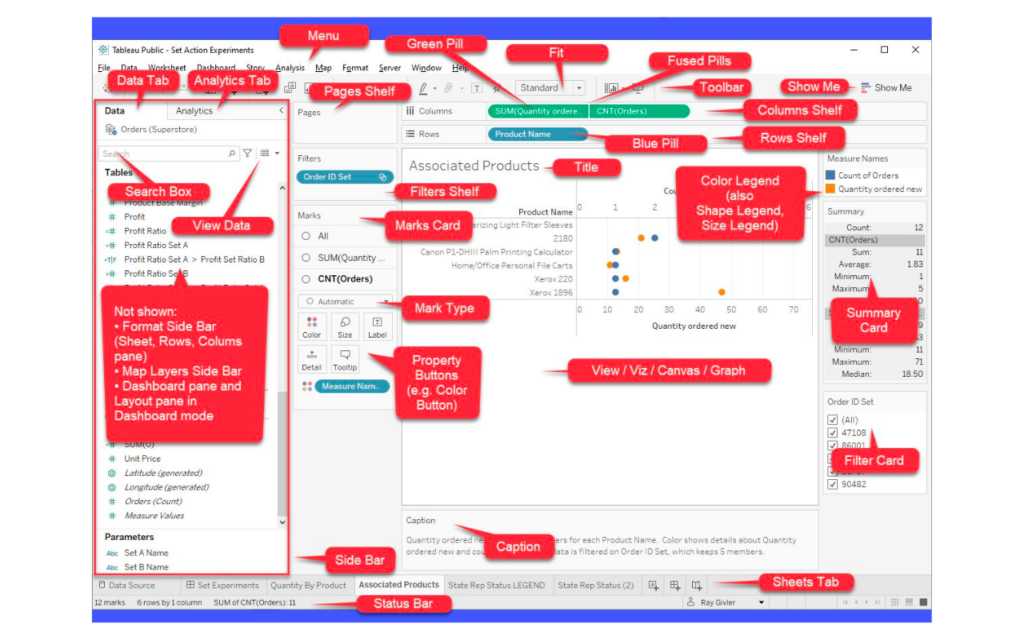
The main components you need to know are:
- The Data Pane (on the left): This is where your data lives. It lists all the fields (columns) from your data source.
- Shelves (at the top): These are areas like Columns and Rows where you drag data fields to build the structure of your chart.
- Cards (to the left of the view): These include the Marks card, Filters card, and Pages shelf. They allow you to control the visual properties of your chart, like color, size, and what data is included.
- The Toolbar (at the very top): This provides quick access to common commands like undo, save, and sorting.
- The View or Canvas (the large central area): This is where your visualization appears.
- Sheet Tabs (at the bottom): This area allows you to navigate between different worksheets, dashboards, and stories in your workbook.
A Guided Tour of the Tableau Workspace
Now let's take a more dynamic look at these components. The following video provides an excellent walkthrough of the entire workspace. We'll watch it in segments to focus on each part.
Tableau Tutorial for Beginners - Getting to know Tableau Desktop Workspace / Interface / Canvas
First, let's get a high-level overview of the worksheet. This video segment will walk you through the main areas we identified in the map above.
Watch the section from 09:26 to 11:03. Focus on identifying the locations of the shelves, the Marks card, the sidebar, and the view.
The Data Pane: Dimensions and Measures
The Data Pane is your starting point for any analysis. You'll notice it's divided into two main sections: Dimensions and Measures. This is one of the most fundamental concepts in Tableau.
- Dimensions are categorical or qualitative data. Think of them as fields you can use to slice or group your data. Examples include Category, Customer Name, or Order Date.
- Measures are numerical or quantitative data. These are the fields you want to aggregate (e.g., sum, average). Examples include Sales, Profit, or Quantity.
Your familiarity with functions like VLOOKUP in Excel touches on a related idea: using a specific field (like a customer ID, which is a dimension) to look up related values (like total sales, a measure). Tableau automates this process visually.
For a clear explanation of this concept, watch this short video segment.
This video provides a very clear and simple distinction between Dimensions and Measures. Understanding this is key to knowing which fields to use when building a chart.
Watch from 01:37 to 02:54. Pay attention to the examples given for both dimensions (fields that don't change) and measures (fields that do change and can be aggregated).
We will explore Dimensions and Measures in more detail in a future lesson, but for now, just remember this basic distinction.
Shelves, Cards, and the Toolbar: Your Building Tools
Now that you know where to find your data fields in the Data Pane, let's look at the tools you'll use to build with them.
- Shelves (Columns and Rows): You build a viz by dragging fields from the Data Pane onto these shelves. Fields on Columns create columns in your table/chart, and fields on Rows create rows.
- Marks Card: This powerful card controls how the data is visually represented. You can drag fields here to change the color, size, label, and other properties of your "marks" (the bars, lines, or circles in your viz).
- Toolbar: This contains shortcuts for frequent actions. You'll often use the undo button (your best friend when exploring!), sorting buttons, and view-fitting options.
Let's return to our detailed video guide to see these components in action.
Tableau Tutorial for Beginners - Getting to know Tableau Desktop Workspace / Interface / Canvas
This next segment dives deeper into the toolbar, the 'Show Me' panel (a helpful chart-starter), and the all-important Marks card.
Watch from 13:09 to 18:17. From 13:09 to 15:14, focus on the common toolbar functions like swapping rows/columns and changing the view fit. From 15:14 to 18:17, observe how the Marks card is used to change the properties of the bars in the chart and how the status bar at the bottom gives you information about your viz.
Your Turn: A Quick Scavenger Hunt
Theory is important, but hands-on exploration solidifies knowledge. Now it's your turn to navigate the workspace.
- Open Tableau Public.
- On the start screen, under "Sample Workbooks," open the Superstore workbook. (If you don't see it, you can download the
Sample - Superstore.xlsfile from the Tableau Public sample data page and connect to it, though we will cover connecting to data formally in the next lesson). - Once it's open, click on one of the existing worksheet tabs at the bottom (e.g., "Profit Map") to go to the worksheet view.
Now, using what you've learned, try to find the following components. Hover your mouse over different icons and areas to see the tooltips that appear.
- Can you locate the Data Pane? Can you see the list of Dimensions and Measures for the Superstore dataset?
- Find the Columns and Rows shelves. What fields ("pills") are on them?
- Locate the Marks card. Click on Color or Size. What happens?
- Find the Toolbar. Can you identify the Undo, Redo, and Save icons?
- Look at the Show Me panel on the top right. Click it to expand and collapse it.
- Finally, look at the Status Bar at the very bottom. How many "marks" are in the current view?
This simple exercise will help you build muscle memory for where everything is located.
Additional Resources
For a different perspective or a quick refresher, Tableau provides excellent official resources. The following reading from the official "Get Started" tutorial covers the same material in a written format.
Tutorial: Get Started with Tableau Desktop
This official Tableau tutorial provides a step-by-step written guide to the workspace. It's a great resource to bookmark for future reference.
On the page, find the table of contents and click the 'GO TO STEP' link for 'Step 2: Drag and drop to take a first look'. Read through this section to reinforce your understanding of the workspace components.
Conclusion
In this lesson, you took the first essential step toward mastering Tableau by learning to navigate its core environment. We've mapped out the Tableau worksheet and identified its key components.
Key Takeaways:
- The worksheet is your main canvas for creating visualizations.
- The Data Pane holds your data, organized into Dimensions (descriptive fields) and Measures (numeric fields you can aggregate).
- You build a viz's structure by dragging fields to the Columns and Rows shelves.
- You control the visual details like color, size, and labels using the Marks card.
- The Toolbar provides quick access to common functions, and the View is where your viz comes to life.
You are now equipped with the basic orientation needed to start building.
Preview of the Next Lesson:
In our next session, we'll take one step back to the very beginning of the workflow: connecting Tableau to file-based data sources like Excel and CSV files. You'll learn the difference between a live connection and a data extract, and how to prepare your data for analysis.