Welcome to your first lesson! We're starting a journey that will bridge your background in finance with the technical skills of data analytics, preparing you for a career as a Business Intelligence (BI) Analyst.
This initial lesson lays the groundwork for everything that follows. We will focus on the fundamental "what" and "why" of data analytics. You will learn a clear definition of data analytics and, more importantly, explore its critical role in modern business decision-making. Since you prefer to build a strong theoretical foundation first, we'll start with these core concepts before diving into any tools. This lesson is the first step in learning how to transform raw numbers into strategic business actions.
What is Data Analytics?
At its heart, data analytics is the science of drawing insights from raw data. In today's world, companies are inundated with information from sales transactions, customer feedback, website traffic, and operational processes. On its own, this data is just a collection of facts and figures. The role of a data analyst is to act as an interpreter, turning this noise into a clear signal.
Let's begin with a formal definition and a quick overview.
Data Analytics: What It Is, How It's Used, and 4 Basic Techniques
This article from Investopedia provides a clear, concise introduction to the field. It defines the term and outlines its purpose in a business context.
Please read the introduction and the section "What Is Data Analytics?". Focus on the core definition provided in the opening paragraphs. Then, continue to the "Understanding Data Analytics" section to see in practice. Pay attention to the examples given.
To complement that reading, let's watch a short video that brings this definition to life. It uses a helpful analogy of a jigsaw puzzle to describe how a data analyst takes complex, scattered pieces of information and assembles them into a coherent picture that can be used to make informed decisions.
What Is Data Analytics? - An Introduction (Full Guide)
This video from CareerFoundry offers a dynamic introduction to what data analytics is and what it's used for.
Watch the section from "What is data analytics?", which provides a great definition and analogy. Then, continue watching the next segment on real-world applications to see some concrete examples of how businesses use these insights.
As you've seen, data analytics isn't just about crunching numbers; it's about solving problems, finding patterns, and ultimately providing the intelligence a business needs to navigate its landscape successfully.
The Goal: Data-Driven Decision-Making
The primary purpose of data analytics in a business context is to enable Data-Driven Decision-Making (DDDM). This means moving away from relying solely on intuition or anecdotal experience and instead basing strategic choices on evidence derived from data.
The impact of this shift is significant. A recent study found that the single greatest benefit companies report from using data analytics is "Better Decision-Making."

To understand DDDM more deeply, let's turn to an article that explains the concept and its benefits.
Data-Driven Decision Making: Make Informed Decisions
This article from ThoughtSpot provides a thorough explanation of data-driven decision-making and its benefits.
First, read the section titled "What is data-driven decision-making?" for a clear definition. Next, read through the four key benefits described in the following section, starting from Proactive business management. As you read about "Improved profitability," note how the text connects data insights directly to financial outcomes like ROI—a core concept in your field of interest.
The key takeaway is that data provides an objective lens through which a company can view its performance. This reduces bias and leads to more reliable and transparent strategic planning, ultimately improving efficiency, customer satisfaction, and profitability.
The Framework: From Data to Action
To appreciate how DDDM works in practice, it's helpful to have a mental model for the process. While there are several ways to visualize the analytics lifecycle, a very useful one frames it as a four-step journey from raw data to impactful action.
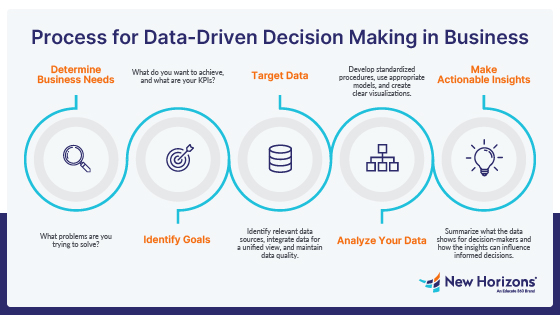
The video below explains this framework clearly. It's based on a well-known concept called the DIKW (Data, Information, Knowledge, Wisdom) pyramid and shows how value is created at each step.
Data-Driven Decision Making - How To Go From Data To Decisions!
This video from Maven Analytics provides an excellent framework for understanding how raw data is transformed into business action.
First, watch from the beginning of the explanation, where the presenter emphasizes that the ultimate goal of any analysis is to inspire action. Next, focus on the core of the lesson from the framework itself. Pay close attention to how the presenter defines each stage: Data (raw, unprocessed facts) Information (data with added context) Insight (meaningful findings that answer "why") Action (a clear, data-driven recommendation) Finally, watch the practical example about monthly transactions. This clearly illustrates how an analyst moves through each stage of the framework to produce a valuable business recommendation.
This framework—Data -> Information -> Insight -> Action—is fundamental to the work of a data analyst. It's the structured thinking that transforms a simple number (e.g., "173 transactions") into a strategic recommendation (e.g., "increase marketing spend on fitness products in January").
Data Analytics in the Financial Industry
This process is applied across all industries, but it's particularly powerful in finance. Decisions regarding investment strategies, risk management, and resource allocation carry significant financial consequences, making objective, data-driven insights invaluable.
The article you read earlier on DDDM has a specific section on this. Let's revisit it to see a concrete example directly relevant to your career goal.
Data-Driven Decision Making: Make Informed Decisions
This section provides a specific example of data-driven decision-making in the financial industry.
Find the section titled "Data-driven decision-making examples" and read the first example, "Financial industry". Notice how it connects data analysis to core financial activities like portfolio management, targeted marketing of financial products, and wealth management.
As you can see, a BI analyst in a financial institution might analyze market trends to optimize a client's portfolio, review customer transaction data to identify opportunities for new financial products, or assess internal performance data to allocate resources more effectively. In all these cases, they are applying the same core principle: using data to make smarter, more profitable decisions.
Conclusion
In this introductory lesson, we have established the foundational concepts of data analytics.
Key Takeaways:
- Data analytics is the process of cleaning, transforming, and analyzing raw data to discover meaningful patterns and insights.
- The primary role of data analytics in business is to enable data-driven decision-making (DDDM), replacing guesswork with choices based on evidence.
- This process leads to tangible benefits, including increased objectivity, improved profitability, and a stronger competitive edge.
- The journey from data to decision follows a structured path: raw data is given context to become information, which is interpreted to reveal insights that inspire business actions.
You've now built the first layer of your theoretical foundation. In our next lesson, we will dissect data analytics further by exploring its four main types: descriptive, diagnostic, predictive, and prescriptive. This will give you a more nuanced understanding of the different kinds of questions data can help you answer.