Hello! Welcome to the final lesson of our module on Operating System Concepts.
Throughout this module, we've explored the foundational building blocks of a server's execution environment. We've defined processes and threads, understood the overhead of context switching, mapped out how programs use stack and heap memory, and dissected various I/O models, culminating in the event loop.
So far, this has been largely theoretical. Today, we bridge theory and practice. Our goal is to use process monitoring tools (ps, top, htop) to inspect process status and resource consumption. You'll learn how to "see" the concepts we've discussed—processes, memory usage, CPU time, process states—in a live Linux system. This is a crucial skill for any backend developer when you need to answer the question, "What is my server actually doing right now?"
1. ps: Taking a Snapshot of Processes
The first tool we'll look at is ps (process status). Its primary function is to take a snapshot of the currently running processes at the exact moment you run the command. This is different from a continuously updating tool; ps gives you a static picture, which makes it perfect for logging, scripting, and comparing system state before and after a change.
Running ps by itself is not very useful, as it only shows processes running in your current terminal. To get a complete picture of everything running on the server (including web servers, databases, and other background services), the most common command is ps aux.
ps aux
Let's break down the aux options:
- a: Show processes for all users.
- u: Display in a user-oriented format (with more details like CPU and memory usage).
- x: Include processes that are not attached to any terminal (these are the background daemons and services we care about).
To understand the output, let's explore a detailed guide.
ps Command Explained - Track, debug, and manage Linux processes
The article 'ps Command Explained' provides an excellent breakdown of the ps aux command. We'll focus on what each column means, as this directly relates to the OS concepts we've been studying.
Please read the section titled 'Basic ps Syntax'. Pay close attention to the bulleted list that explains the meaning of each column in the ps aux output: USER, PID, %CPU, %MEM, VSZ, RSS, TTY, STAT, START, TIME, and COMMAND.
As you read, connect those columns back to our previous lessons:
- PID: The unique Process ID we discussed in lesson 3.1.
- %CPU / TIME: Represents the CPU time a process has consumed, relating to scheduling and context switching.
- %MEM / VSZ / RSS:
VSZ(Virtual Size) andRSS(Resident Set Size) directly reflect the memory concepts from lesson 3.4.RSSis particularly important as it shows how much physical RAM a process is actually using. - STAT: The process state. You'll see
Sfor sleeping (often waiting on I/O),Rfor running, and occasionallyZfor a zombie process.
Filtering and Sorting with ps
The real power of ps comes from combining it with other standard Unix tools. Since its output is just text, we can pipe it to commands like grep (to filter) and sort (to order).
- Find a specific process:
# The brackets around the 'n' prevent grep from matching its own process ps aux | grep '[n]ginx' - Find the top 5 memory-consuming processes:
# --sort=-%mem sorts by memory in descending order. `head` takes the first 5 lines. ps aux --sort=-%mem | head -n 5 - Find the top 5 CPU-consuming processes:
ps aux --sort=-%cpu | head -n 5
You can also ask ps to display processes in a hierarchy, which visually shows the parent-child relationships we talked about.
Using the ps Command | Efficient Process Monitoring on Linux Systems
This video, 'Using the ps Command', provides a great visual demonstration of some of these advanced features, including the process hierarchy view.
Watch the segment from 07:52 to 09:47. The presenter shows how to use the -H (hierarchy) and -e (all processes) flags to create a tree-like view. This helps you see which process spawned which child processes, for example, seeing worker processes under a main master process.
2. top: A Live System Dashboard
While ps is great for snapshots, you'll often want to see what's happening on your server in real-time. For this, we use top. It provides a continuously updating dashboard of system resource usage. It's pre-installed on virtually every Linux system, making it an essential tool to know.

The top interface can be divided into two parts: the summary area at the top and the process list below it.
Understanding Linux System Performance | The Top Command
The video 'Understanding Linux System Performance | The Top Command' offers a fantastic, detailed walkthrough of the entire top interface. It explains every number and what it signifies for your server's health.
Please watch from the beginning to 18:01. The video is structured perfectly for our needs: 00:00 - 04:00: Covers the first two lines, including load average (a critical metric of system load) and task states (running, sleeping, zombie). 04:00 - 08:52: Explains the process states in more detail, including a clear explanation of parent/child relationships and zombie processes. 08:52 - 12:29: Details the CPU usage line (us, sy, id, wa). Pay close attention to wa (I/O Wait), as a high value can indicate your application is bottlenecked on disk or network access. 12:29 - 14:04: Breaks down the memory and swap usage lines. High swap usage is a strong indicator that your system is running out of physical RAM. 14:04 - 18:01: Covers the process list and the most important interactive commands, such as sorting by CPU (P), sorting by memory (M), and killing a process (k).
After watching, you should be able to launch top and have a clear understanding of your system's current load, memory pressure, and which processes are consuming the most resources.
3. htop: The Interactive Powerhouse
htop is a powerful, third-party replacement for top. It presents the same information but in a much more user-friendly and visually intuitive way, with color-coded graphs, full command lines, and easy-to-use function keys for interaction. If you have a choice, you will almost always want to use htop.
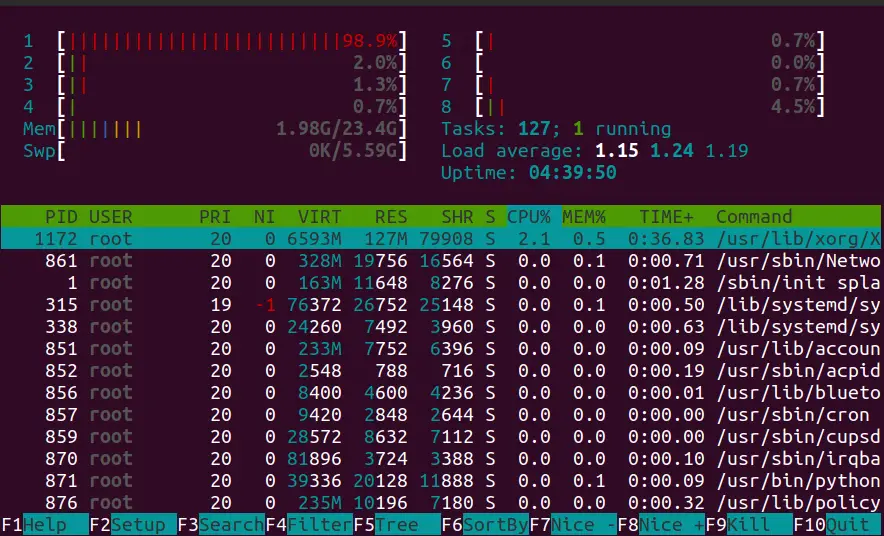
htop's main advantages over top include:
- Visual Meters: CPU (per core), Memory, and Swap usage are shown as easy-to-read bars.
- Easy Interaction: You can scroll vertically and horizontally through the process list, and use function keys (F1-F10) for common actions instead of single-letter commands.
- Built-in Features: Searching (F3), filtering (F4), and tree view (F5) are built-in and trivial to use.
- Process Management: You can select multiple processes and kill them at once.
Let's dive into how to use it.
How to Use the htop Command to Monitor System ...
This guide on 'How to Use the htop Command' provides a clear overview of its features and how to interpret its output.
Please read the following parts: Part 1. The 'htop' Summary Area: This explains the color-coded CPU, RAM, and Swap meters, as well as the Load Average and Tasks displays. Part 2. Active Processes: This breaks down the columns in the process list, which are similar to top but often more detailed. Part 3. 'htop' Commands: This is the most important section. Review the function key menu (F1-F10) and the keyboard shortcuts (u for user, p for CPU sort, m for memory sort). Part 4. Using the Data Inside 'htop': This section provides practical advice on how to use these features to find the source of performance issues.
4. Hands-On Practice
Now it's time to apply what you've learned. If you are on a Linux machine (or using a VM or SSHing into a server), open a terminal. If you are on macOS, these commands will work as well, though some flags for ps might differ slightly. htop can be installed with brew install htop.
Try to answer the following questions using the tools we just discussed:
- Using
ps: What is the Process ID (PID) of the very first process that starts on your system? (Hint: It's usuallysystemdon Linux orlaunchdon macOS, and its PID is always 1).Command
ps aux | grep '[s]ystemd'orps -p 1 - Using
toporhtop: Start the tool. What is your system's load average right now? How many CPU cores does it have? - Using
htop: PressF6or>to open the sort menu and sort byPERCENT_MEM. Which process is using the most memory? - Using
htop: PressF5to toggle the tree view. Can you find your terminal application and the shell process running inside it?
This practical exercise solidifies your understanding by connecting the command outputs to real, running software on your machine.
Conclusion
You are now equipped with the essential tools to observe and analyze a running backend server. This ability is fundamental to performance tuning, debugging, and capacity planning.
Key Takeaways:
psis a command-line tool that provides a static snapshot of processes. It's highly scriptable and ideal for logging or comparing states. Theps auxcommand is your go-to for a complete system view.topis a standard, real-time process monitor available on all Linux systems. It provides a live dashboard of CPU, memory, and process activity. Key interactive commands includeP(sort by CPU) andM(sort by memory).htopis a modern, enhanced replacement fortop. It offers a more intuitive interface with color-coded meters, easy scrolling, and powerful features like filtering, searching, and tree view via function keys.- These tools give you a direct window into the OS-level concepts we've studied, allowing you to see process states, memory consumption (
RSS), and CPU utilization in action.
Preview of the Next Lesson:
We have now concluded our deep dive into the operating system layer. In the next module, "Web Servers and Application Runtimes," we will move one layer up the stack. We'll start by bridging the gap between low-level OS concepts and web applications. In the first lesson, you will build a minimal TCP server in Python using the socket module. This will give you a concrete understanding of how server applications bind to ports, listen for connections, and handle clients, setting the stage for understanding how tools like Nginx and Gunicorn automate this process.