Hello! Welcome to the next lesson in our deep dive into backend systems.
In the previous lesson, we explored connection pooling and saw how it's critical for managing communication between your application and the database efficiently. We established that creating connections is expensive, and reusing them is key to performance.
Now, we'll follow the request further. Once your application sends a SQL query over that efficiently managed connection, what does the database do with it? How does it decide the best way to retrieve the data you asked for? This is the job of the query planner, the database's internal strategist.
Today's learning outcome is to use EXPLAIN in PostgreSQL to read and interpret a query execution plan. Think of EXPLAIN as a window into the planner's mind. By the end of this lesson, you'll be able to look at a query's execution plan and begin to understand how PostgreSQL intends to run it, setting the stage for diagnosing and fixing slow queries.
The Planner's Dilemma: Finding the Cheapest Path
Before we look at any output, it's crucial to understand what the query planner is trying to achieve. For any non-trivial SQL query, there are often dozens, if not thousands, of ways to execute it. Should it scan an entire table? Should it use an index? If joining tables, which table should it start with, and which join algorithm should it use?
Each choice has a massive impact on performance. The planner's job is to find the "cheapest" execution plan. But it doesn't measure cost in time; it uses abstract cost units based on estimates of I/O and CPU work.
To understand how the planner makes these decisions, we need to look at its two primary inputs: a cost model and statistics about your data.
The SQL Query Roadtrip: The Query Planner
The article 'The SQL Query Roadtrip: The Query Planner' from Internals for Interns provides a fantastic, deep look into how the planner thinks. It explains the foundational concepts of cost and statistics, which is exactly the root-level detail you're interested in.
Please read the introduction and the first two main sections: 'Understanding Costs: How PostgreSQL Measures Work' and 'Statistics: Understanding Your Data'. Focus on: Why cost is measured in abstract units, not time. The difference between seq_page_cost and random_page_cost and its importance. The distinction between 'Startup Cost' and 'Total Cost'. The types of statistics PostgreSQL collects (MCVs, histograms, correlation) and why they are vital for good estimates.
This is the theoretical bedrock of everything we'll see next. The key takeaways are:
- The planner makes a decision by comparing the estimated total cost of various plans.
- This cost is heavily influenced by I/O. A high
random_page_cost(the default) makes the planner favor Sequential Scans over Index Scans unless the query is highly selective (returns very few rows). - The planner's estimates are only as good as its statistics. If you've loaded a lot of data, running the
ANALYZEcommand is crucial for updating these statistics and enabling the planner to make smart choices. A large mismatch between estimated rows and actual rows in a plan is often a sign of stale statistics.
Reading Your First Query Plan with EXPLAIN
Now that we understand the theory, let's see what a query plan looks like. You get this by prefixing your SQL query with the EXPLAIN command.
Let's watch a practical demonstration of EXPLAIN on some basic queries.
Postgres Explain Explained - How Databases Prepare Optimal Query Plans to Execute SQL
The video 'Postgres Explain Explained' by Hussein Nasser gives a clear, concise walkthrough of basic EXPLAIN outputs. It's a great first step into interpreting these plans.
Watch from the beginning to 10:01. Pay attention to how the plan changes for different queries: A simple SELECT * results in a Sequential Scan. Adding an ORDER BY introduces a Sort operation. Using a WHERE clause on an indexed column results in an Index Scan. Selecting only indexed columns can lead to an Index-Only Scan.
Let's break down the structure of the output you saw. A query plan is a tree of nodes. Each node represents one operation.
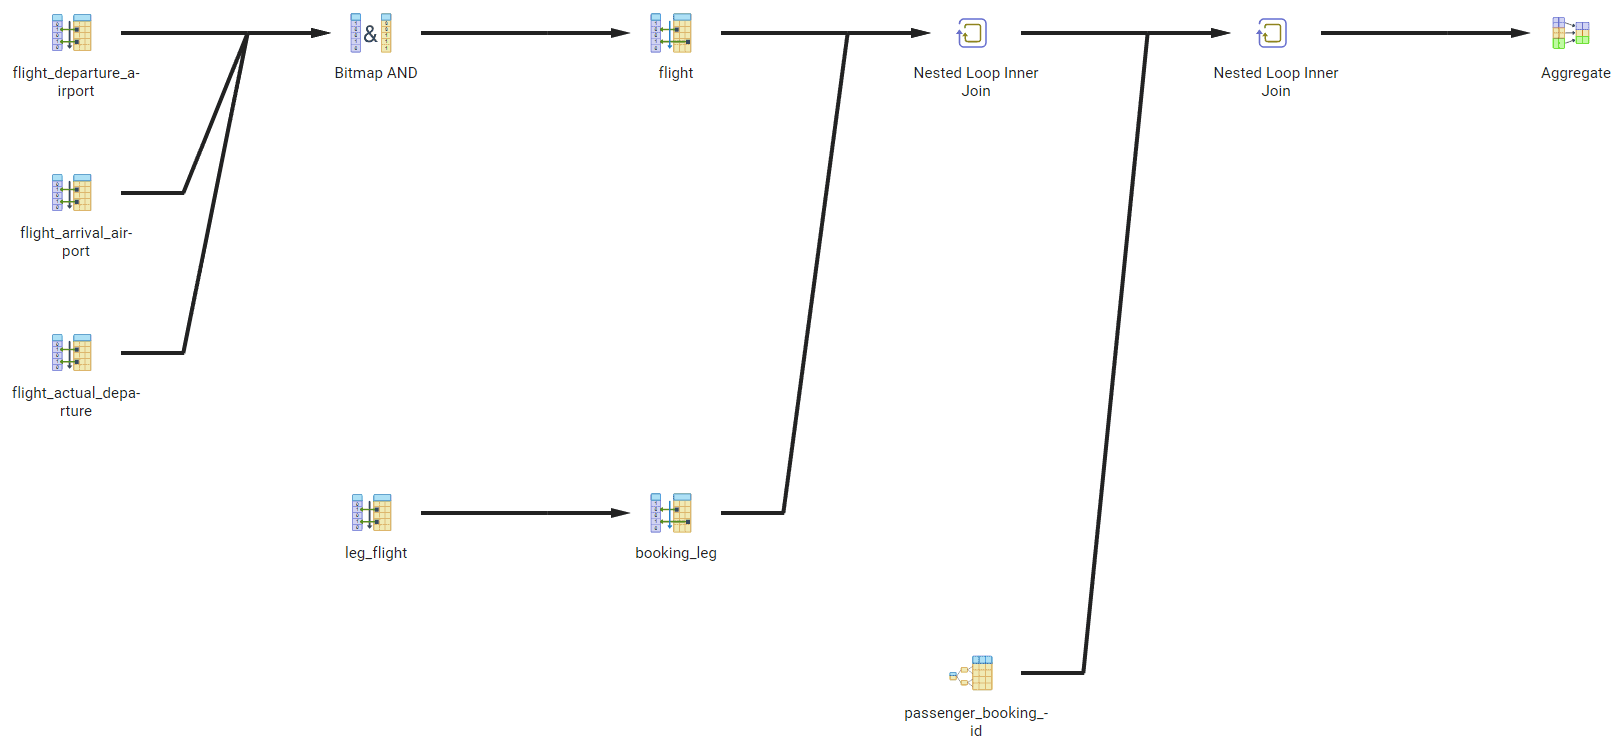
Let's look at the simplest plan, a Sequential Scan:
EXPLAIN SELECT * FROM users;

-- QUERY PLAN --
-- Seq Scan on users (cost=0.00..2819.00 rows=100000 width=113)
Here's how to decode that line, using the concepts we've learned:
Seq Scan on users: This is the operation type (or node). It tells us PostgreSQL will read the entireuserstable from start to finish.(cost=0.00..2819.00 ...): These are the planner's estimates.cost=0.00is the startup cost: the estimated work to get the first row. For a sequential scan, it's zero because it can return the first row it finds immediately.cost=2819.00is the total cost: the estimated work to get all rows. This is the number the planner uses to compare plans.
(rows=100000 ...): The planner estimates this operation will return 100,000 rows.(width=113): The planner estimates the average width of each returned row will be 113 bytes.
When you see a more complex plan, you'll see indented nodes with arrows (->). These are child nodes that feed their results into their parent. You always read the plan from the innermost (most indented) nodes outwards.
From Estimate to Reality: EXPLAIN ANALYZE
EXPLAIN is powerful, but it only shows the planner's guess. What if the guess is wrong? To find out what actually happened, we use EXPLAIN ANALYZE. This command executes the query and gives you the plan with actual performance metrics alongside the estimates.
Warning: Because EXPLAIN ANALYZE runs the query, do not use it on UPDATE, INSERT, or DELETE statements on your production database unless you intend for the data modification to happen.
A beginners guide to EXPLAIN ANALYZE – Michael Christofides
The video 'A beginners guide to EXPLAIN ANALYZE' from Tiger Data is excellent for understanding the crucial difference between EXPLAIN and EXPLAIN ANALYZE.
Watch from 02:31 to 07:29. This segment clearly contrasts the output of EXPLAIN (estimates only) with EXPLAIN ANALYZE (estimates + actuals).
Let's look at an EXPLAIN ANALYZE output for an index scan:
EXPLAIN ANALYZE SELECT * FROM users WHERE id = 42;

-- QUERY PLAN --
-- Index Scan using users_pkey on users (cost=0.29..8.31 rows=1 width=113) (actual time=0.007..0.007 rows=1 loops=1)
--   Index Cond: (id = 42)
-- Planning Time: 0.444 ms
-- Execution Time: 0.015 ms
Notice the new information:
(actual time=0.007..0.007 ...): These are the actual performance measurements.actual time=0.007is the time in milliseconds it took to get the first row.actual time=0.007(the second number) is the time it took to get all rows from this node.
(rows=1 ...): The actual number of rows returned by this node. Comparing this to the estimatedrows=1shows the planner's estimate was accurate.(loops=1): The number of times this node was executed. In a simple query, this is 1. In more complex plans (like a Nested Loop join), you might see an inner node loop many times.Planning Time: How long it took the planner to generate the query plan.Execution Time: The total time spent running the query, including planning.
The single most important skill in query tuning is comparing the planner's rows estimate to the actual rows and identifying which node has the highest actual time.
A Systematic Approach to Interpretation
Now that you can read the output, how do you use it effectively? It's easy to get lost in the details. Having a structured process is key.
Mastering PostgreSQL EXPLAIN ANALYZE: A Deep Dive into Query ...
Let's turn to a practical guide from 'Mastering PostgreSQL EXPLAIN ANALYZE' that provides a clear, step-by-step breakdown of how to read the output systematically.
Read the section 'Understanding the Basics'. This serves as a great written summary of the output format, reinforcing the difference between cost estimates and actual performance metrics we just saw in the video.
Now let's get a high-level workflow for analyzing a plan.
A beginners guide to EXPLAIN ANALYZE – Michael Christofides
The 'beginners guide to EXPLAIN ANALYZE' video also provides a fantastic 5-step process for analyzing a query plan.
Watch from 09:29 to 21:27. This part outlines a professional workflow for tackling a slow query using EXPLAIN ANALYZE. Pay close attention to the advice about calculating the time spent in each node individually.
Here is a summary of that excellent workflow:
- Use Realistic Data: Analyze queries on a database that has a similar size and data distribution as your production environment. A plan on a 100-row table is useless if the production table has 100 million rows.
- Get Maximum Information: Run
EXPLAIN (ANALYZE, BUFFERS). TheANALYZEoption gives you actual times, andBUFFERStells you about I/O activity (how many data blocks were read from disk vs. from cache). - Start at the Bottom: Check the total
Execution Timefirst to get a baseline. - Find the Most Expensive Node: Read the plan from the inside out. For each node, look at the
actual time. The time reported for a parent node includes the time of its children. To find the work done by the parent itself, subtract the time of its children. Your goal is to find the node where the most time is being spent. - Look for Clues: Once you've identified the slowest node, investigate why it's slow. Is there a huge difference between estimated
rowsand actualrows? Is aSortoperation spilling to disk? Is it aSeq Scanwhere you expected anIndex Scan?
Conclusion
You've just taken your first major step into the world of database performance tuning. You are no longer flying blind; you now have the tool to see exactly how the database is executing your queries.
Key Takeaways:
- The Query Planner creates an execution plan by estimating the "cost" of different strategies, aiming for the cheapest one.
- These estimates rely on statistics about your data. Stale statistics lead to bad plans.
EXPLAINshows you the planner's estimated plan.EXPLAIN ANALYZEexecutes the query and shows you the actual performance metrics alongside the estimates.- A query plan is a tree of nodes. You interpret it from the most indented nodes outwards.
- Your first goal when analyzing a plan is to find the node with the highest
actual timeand to check for large discrepancies between estimated and actualrows.
Preview of the Next Lesson
You now know how to get and read a query plan. In the next lesson, we will put this skill to practical use. The learning outcome will be to identify common causes of slow queries (e.g., full table scans, N+1 problems) from an execution plan. We'll look at real-world EXPLAIN outputs and learn to spot the classic "red flags" that indicate a performance bottleneck.