Hello! Welcome to the next lesson in our module on Deployment, Containerization, and Observability.
In our last lesson, we configured a complete multi-service environment using Docker Compose. You now have the ability to define an entire backend stack—application, database, and cache—in a single docker-compose.yml file, creating a reproducible environment that works anywhere.
This is a huge step forward for development, but it leaves a critical question unanswered: How do we get our application from our local machine to a live server where users can access it? Doing this manually is slow, risky, and doesn't scale.
This lesson introduces the solution: Continuous Integration and Continuous Deployment (CI/CD). We will explore how to automate the entire process of building, testing, and releasing your software. By the end of this lesson, you will be able to describe the key stages of a CI/CD pipeline for a backend service, providing the conceptual foundation for building automated deployment systems.
1. The Problem: Why Manual Deployments Are Painful
Before we dive into the "how" of CI/CD, it's crucial to understand the "why." Imagine a team trying to release a new version of their application without automation. The process is often fraught with challenges.
To get a sense of this, watch the following video. It vividly describes a common, manual workflow and the problems it creates—merge conflicts, broken main branches, code freezes, and high-stress deployments.
CI/CD Explained: The DevOps Skill That Makes You 10x More Valuable
This video from TechWorld with Nana sets the stage by illustrating a classic, manual deployment workflow and the chaos it can cause. This will help you appreciate the problems that CI/CD is designed to solve.
Watch the first four minutes of the video (00:15 - 03:55). Pay attention to the pain points mentioned, such as merge conflicts, manual testing, code freezes, and the anxiety associated with production deployments.
As you can see, relying on manual steps makes the release process a major, high-risk event. CI/CD aims to transform it into a routine, automated, and low-risk activity.
2. The Solution: Continuous Integration and Continuous Delivery/Deployment
CI/CD is a set of practices that form the backbone of modern DevOps. It's not a single tool, but a philosophy and a workflow enabled by automation. Let's break down the acronyms.
CI/CD Pipeline - System Design
This article from GeeksforGeeks provides clear and concise definitions of the core concepts. We'll use it to establish our foundational vocabulary.
Read the first three sections: '1. Continuous Integration (CI)', '2. Continuous Delivery (CD)', and '3. Continuous Deployment (CD)'. Focus on the main goal of each practice and the key differences between them.
To summarize the key ideas:
-
Continuous Integration (CI): The practice of developers frequently merging their code changes into a central repository. Each merge automatically triggers a build and an automated test run.
- Goal: To detect integration bugs early and often.
-
Continuous Delivery (CD): An extension of CI. After the testing phase, the application is automatically packaged and prepared for release to a production-like environment. The final deployment to actual production is triggered by a manual approval (e.g., a button click).
- Goal: To ensure you always have a production-ready build that can be deployed at any time.
-
Continuous Deployment (also CD): The ultimate level of automation. It extends Continuous Delivery by automatically deploying every change that passes all automated tests directly to production, without any human intervention.
- Goal: To minimize the time between writing a line of code and having it available to users.
For the rest of this lesson, we will focus on the pipeline that makes all of this possible.
3. The Key Stages of a CI/CD Pipeline
A CI/CD pipeline is an automated assembly line for your software. It takes source code as input and produces a deployed application as output. While the specific tools can vary, the logical stages are generally consistent. We can model this as a sequence: Source → Build → Test → Deploy.
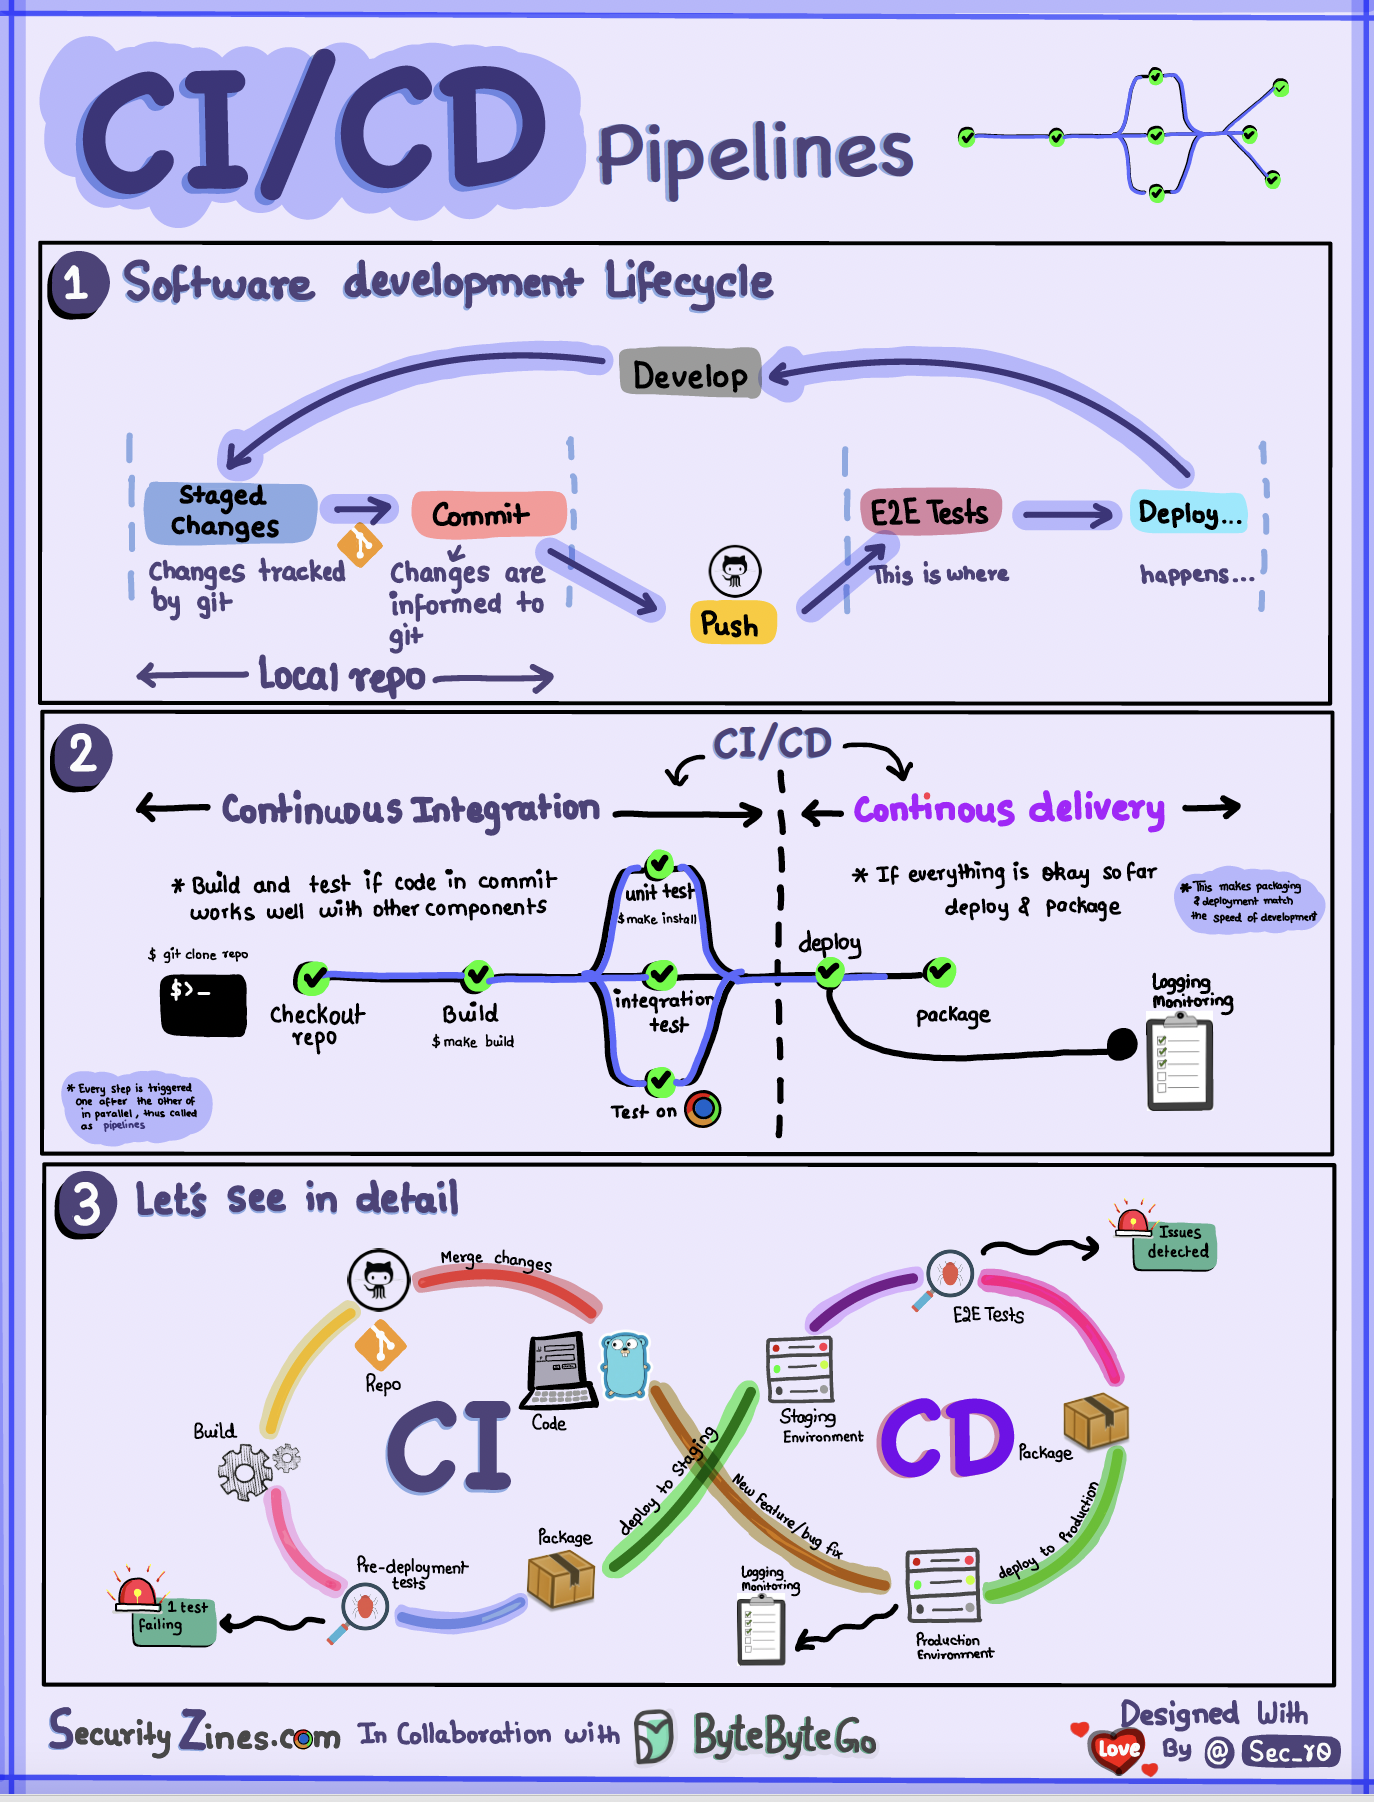
Let's break down each stage in the context of a backend service like the Django application we containerized.
CI/CD Pipeline - System Design
This article, again from GeeksforGeeks, provides an excellent, detailed breakdown of the four primary stages of a CI/CD pipeline. We'll use this as our guide.
Read the section '5. Components of a CI/CD Pipeline', focusing on the descriptions of Stage 1 (Source), Stage 2 (Build), Stage 3 (Test), and Stage 4 (Deploy). As you read, think about how each stage applies to a containerized Python application.
Here is a summary of those stages, with context for our backend work:
Stage 1: Source (Trigger)
- Action: A developer commits and pushes code to a version control system (VCS) like GitHub. This could be a direct push to a main branch or, more commonly, creating a pull request from a feature branch.
- Trigger: This event is detected by the CI/CD orchestrator (e.g., GitHub Actions, Jenkins, GitLab CI) via a webhook, which automatically starts the pipeline.
- Initial Checks: Often, quick "pre-flight" checks run here, such as linting (e.g.,
flake8,black) and static code analysis (SAST) to catch simple errors and style issues before any heavy processing begins.
Stage 2: Build
- Action: The source code is transformed into a runnable, self-contained package called an artifact.
- For our backend: This is where the
docker buildcommand runs, using theDockerfileto create a Docker image. This image is our artifact. It bundles the application code, Python dependencies, and the runtime environment. - Immutability: A crucial principle is that this artifact is immutable and versioned (e.g., tagged with the commit hash
my-app:a1b2c3d). The exact same image will be used in all subsequent stages, ensuring consistency and eliminating "it works on my machine" issues. - Artifact Storage: The newly built image is pushed to a container registry (e.g., Docker Hub, AWS ECR, Google Artifact Registry).
Stage 3: Test
- Action: The artifact is put through a gauntlet of automated tests to verify its quality and correctness. This is the heart of CI, enforcing the "fail fast" principle—if any test fails, the pipeline stops.
- Common Test Types for a Backend Service:
- Unit Tests: Small, fast tests that check individual functions or classes in isolation (
pytest). - Integration Tests: Verify that different components work together correctly. For our stack, this could involve spinning up the
webanddbcontainers (using Docker Compose) to ensure the Django app can successfully connect to and query the PostgreSQL database. - Security Scanning:
- Dependency Scanning: Tools like Snyk or
pip-auditcheck yourrequirements.txtfor packages with known vulnerabilities (CVEs).
- Container Image Scanning: Tools like Trivy or Clair scan the layers of your Docker image for OS-level vulnerabilities.
- Dependency Scanning: Tools like Snyk or
- Unit Tests: Small, fast tests that check individual functions or classes in isolation (
Stage 4: Deploy
- Action: Once the artifact has passed all tests, it is deployed to one or more environments.
- Environment Promotion: A key concept here is promoting the build through a series of environments, each with a specific purpose.
- Staging (or Pre-production): A production-like environment where the new artifact is deployed. This is where more expensive tests run, such as End-to-End (E2E) tests that simulate full user workflows, performance tests, and Dynamic Application Security Testing (DAST).
- Production: The final destination. After successful validation in staging, the artifact is deployed for real users. For Continuous Delivery, this step requires manual approval. For Continuous Deployment, it's fully automatic.
4. Environments and Branching Strategy
The flow of code from a developer's machine to production is tightly coupled with the project's branching strategy in Git. Different branches often correspond to different environments and trigger different pipelines.
This next video explains this relationship in detail, showing how code moves from feature branches to a main branch and finally to release branches, with each step targeting a different environment (Dev, Staging, Production).
CI/CD Workflow from Dev to Stage to Prod Environments| Complete CI/CD Process |#abhishekveeramalla
This technical video from Abhishek Veeramalla provides a deep dive into how branching strategies map to different deployment environments. This is crucial for understanding how a CI/CD process is organized in a real-world company.
Watch from 06:41 to 24:25. This long segment covers three key topics: Branching Strategy (06:41 - 13:10): Understand the roles of feature, main, release, and hotfix branches. Staging Environment (13:10 - 19:14): See how merging to the main branch triggers deployment to a staging/QA environment for integration testing. Pre-prod & Production (19:14 - 24:25): Learn how a release branch is used to deploy to pre-production and finally to production.
This model of promoting a single, immutable artifact through progressively more critical environments is fundamental to building reliable automated release processes.
5. A Concrete Example: CI/CD for a Django Application
Let's visualize what a complete pipeline for a Django application might look like. The following diagram shows the integration of many popular DevOps tools.

While this diagram is complex, you can now recognize the key stages we've discussed:
- Source: A developer pushes code to GitHub.
- Build: A Jenkins CI job is triggered. It checks out the code and builds a Docker image.
- Test: Static analysis (SonarQube) and image scanning (Trivy) are performed.
- Deploy: The image is deployed to a testing environment. After validation, it is deployed to QA and Production Kubernetes clusters.
The specific tools (Jenkins, ArgoCD, etc.) are implementation details. The core workflow—Source, Build, Test, Deploy—remains the same.
Conclusion
In this lesson, we have demystified the world of CI/CD by breaking it down into a logical sequence of automated stages. You have moved from understanding how to package an application with Docker to conceptualizing the "assembly line" that carries that package from your code editor all the way to production.
Key Takeaways:
- CI/CD automates software delivery, transforming it from a risky, manual event into a reliable, repeatable process.
- Continuous Integration (CI) focuses on frequent code merges, automated builds, and testing to catch bugs early.
- Continuous Delivery/Deployment (CD) extends CI by automating the release process to staging and production environments.
- A typical pipeline consists of four key stages: Source (triggering from Git), Build (creating a Docker image), Test (running unit, integration, and security tests), and Deploy (promoting the image through environments like Staging and Production).
- Branching strategy is tied to deployment strategy. Different Git branches often map to different environments and pipeline configurations.
Preview of the Next Lesson
Now that we have a mental model for automatically deploying our backend service, our next concern becomes: "How do we know what our application is doing once it's running?" To answer this, we need to make our application observable. In the next lesson, we will begin exploring this topic by focusing on a foundational pillar of observability: structured logging. You'll learn how to implement it in a Python application and why it is vastly superior to simple print statements or unstructured log messages.