Hello! Welcome to your next lesson in our journey through Deployment, Containerization, and Observability.
In our previous lesson, we dove into structured logging, the first pillar of observability. You learned how to transform your application's event stream from a simple text file into a rich, machine-readable dataset. Logs are fantastic for answering the question: "What specific event happened at a specific time?"
However, to understand the overall health of your service, you need to look at aggregates. How many requests are you serving per second? What percentage of them are failing? Are your users experiencing slowness? This brings us to the second pillar of observability: metrics.
Today, we will focus on a simple yet powerful framework for service monitoring called the RED method. By the end of this lesson, you will be able to identify the key backend metrics—Rate, Errors, and Duration—that provide a high-level, at-a-glance view of your service's health.
1. From Four Golden Signals to the RED Method
Modern monitoring practices were heavily influenced by Google's Site Reliability Engineering (SRE) culture. In their foundational book, they outlined "Four Golden Signals" for monitoring any system: Latency, Traffic, Errors, and Saturation.
Monitoring the Mattermost server with Prometheus and Grafana
Let's start by briefly reviewing these four signals to understand the foundation. This article from the Mattermost blog provides a clear and concise summary.
Read the section 'What are the four golden signals?'. This will give you the context from which the RED method evolved.
While comprehensive, the Four Golden Signals can be complex to apply universally. For request-driven services, like the APIs you build, there is a more focused and pragmatic approach: the RED method. Coined by Tom Wilkie, it distills the golden signals into the three most crucial metrics for a service:
- Rate: The number of requests your service is receiving, per second.
- Errors: The number of those requests that are failing, per second.
- Duration: The amount of time each request takes to process.
This method gives you a straightforward, service-centric dashboard for understanding service health.
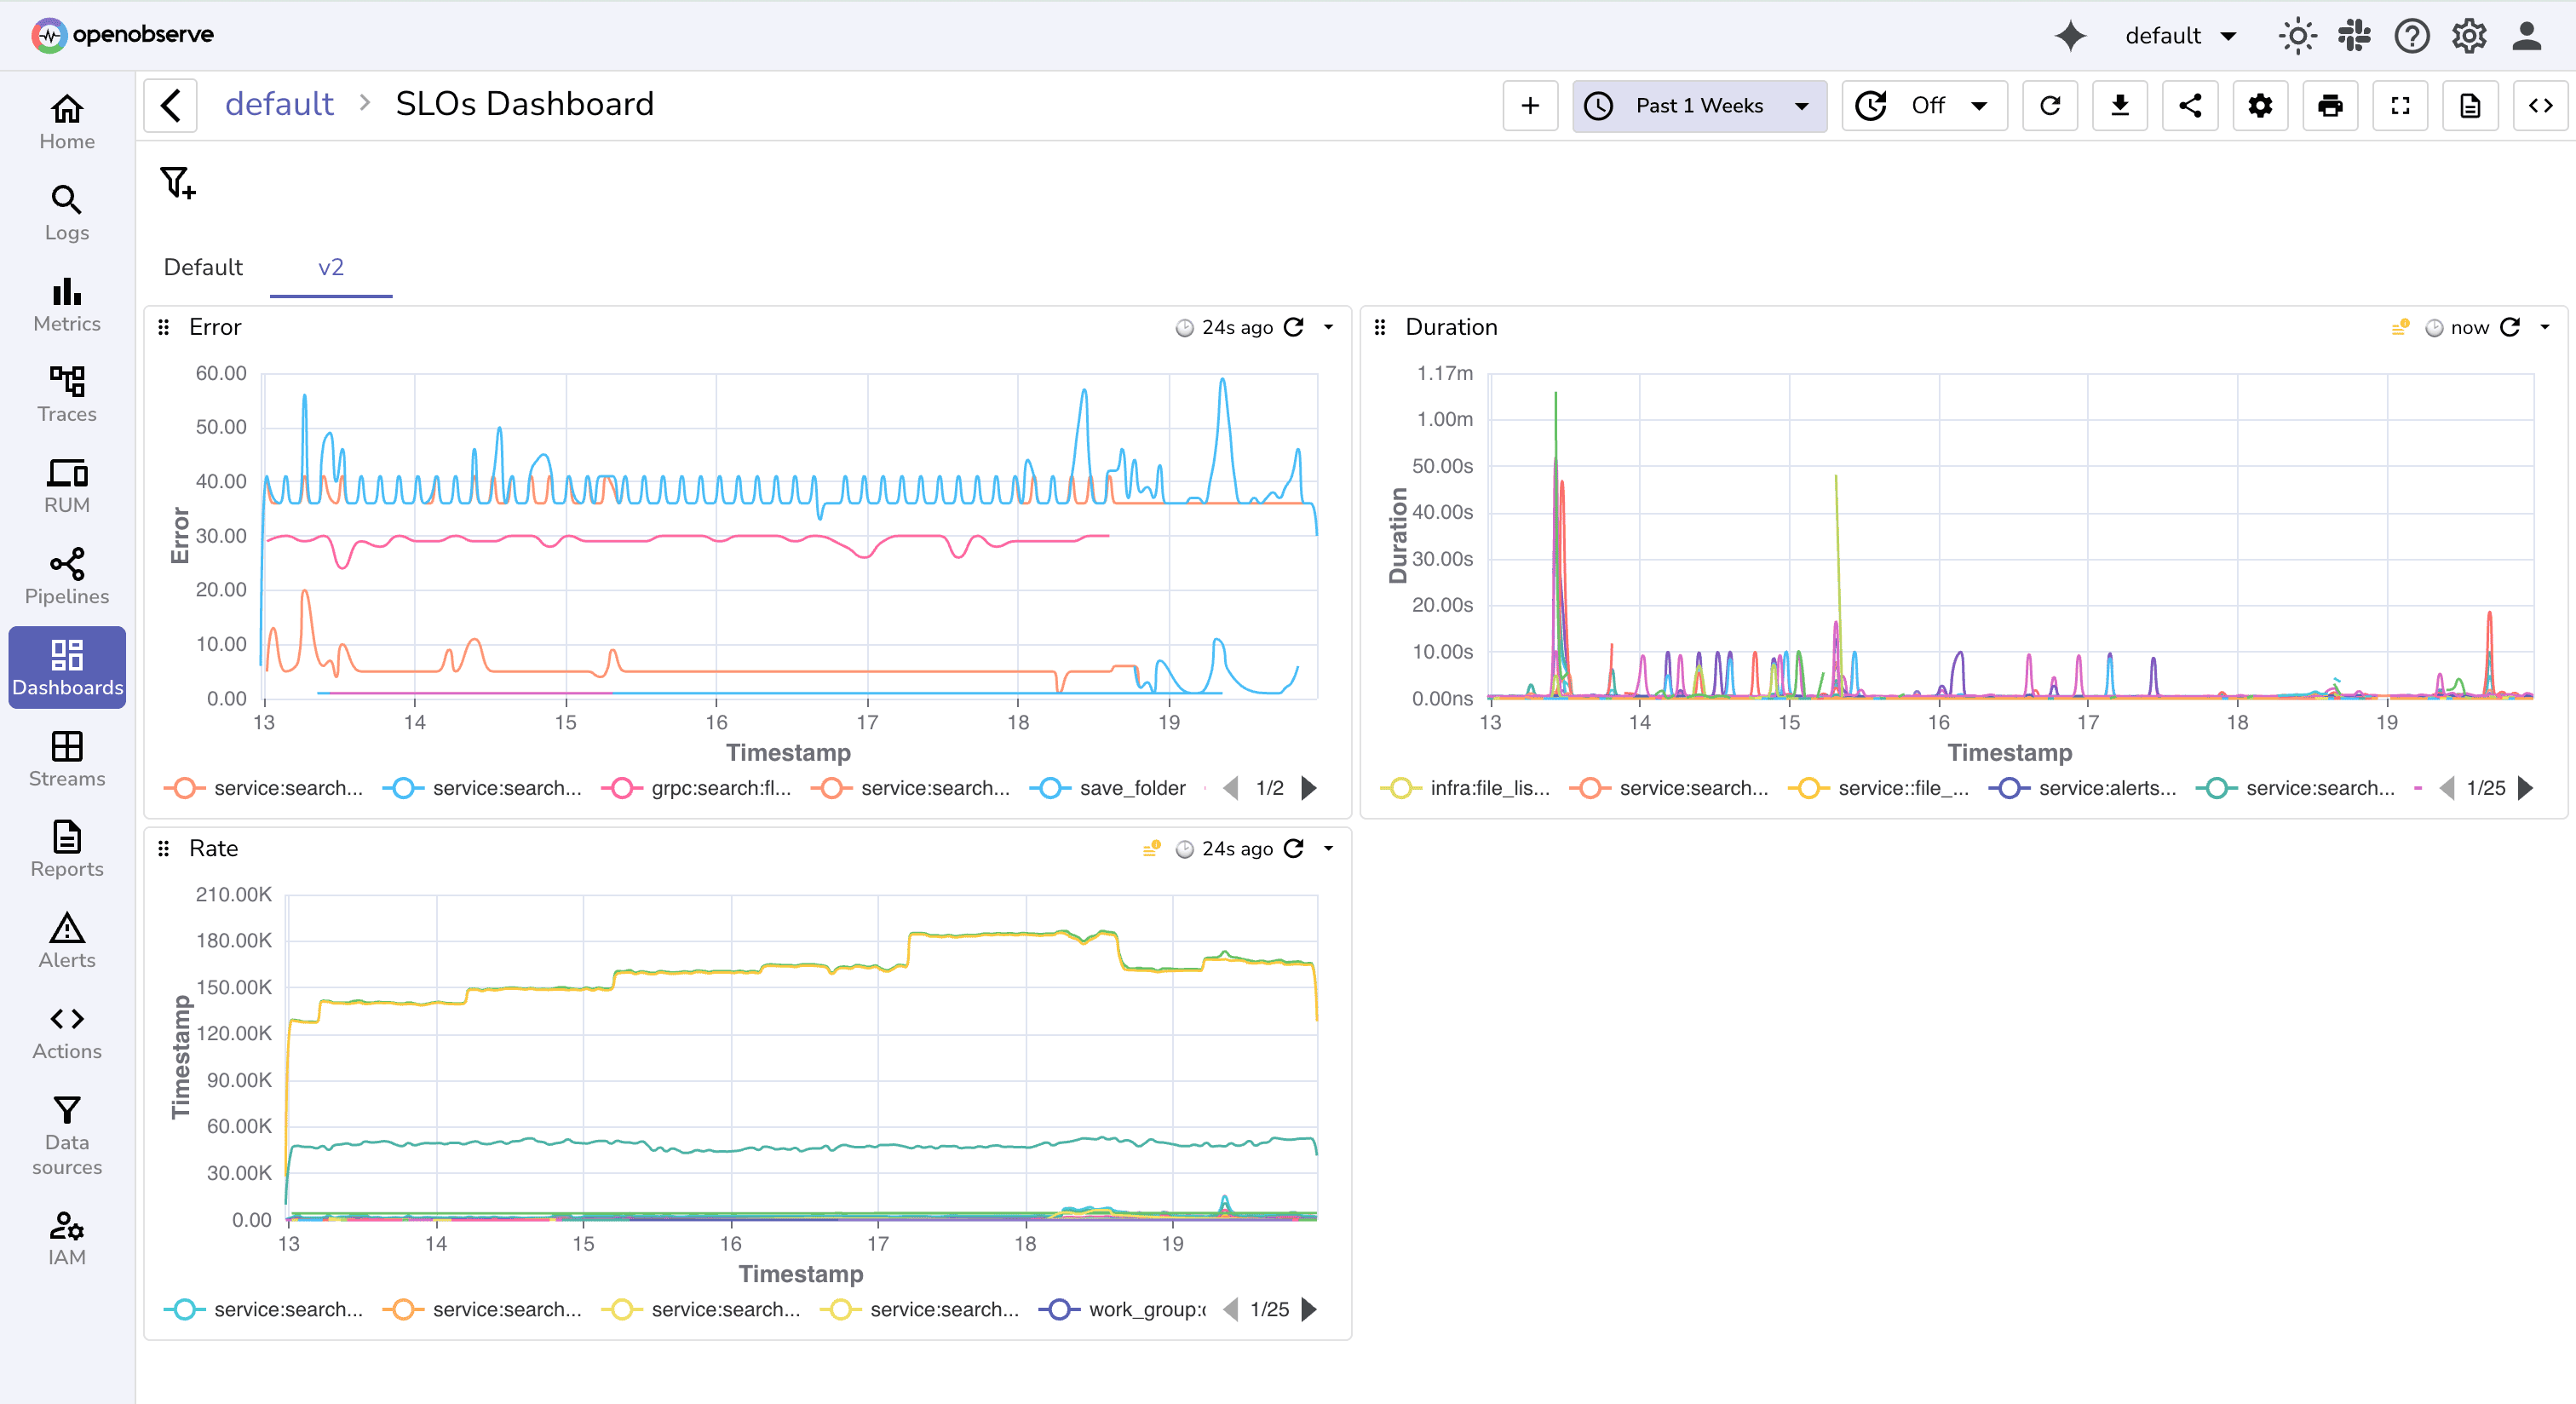
Now, let's explore each of these metrics in detail.
2. Rate: Measuring Throughput
Rate (or throughput) is the measure of demand on your service. It's typically expressed as requests per second (RPS).
- Why it matters: Monitoring the request rate helps you understand traffic patterns, plan for capacity, and detect anomalies. A sudden, unexpected drop to zero might indicate an outage or a deployment failure. A sharp spike could be a sign of a DDoS attack or the effect of a new marketing campaign.
- How it's measured: In monitoring systems like Prometheus, this is typically implemented with a
Counter. A counter is a metric that only ever increases. You instrument your application (often in a middleware) to increment this counter for every single incoming request. The monitoring tool can then calculate the rate of increase over a time window (e.g., the last 5 minutes) to give you the requests per second.
3. Errors: Measuring Failures
Errors represent the rate of failed requests.
- Why it matters: This is a direct measure of user-facing problems. A high error rate is a clear signal that something is wrong. Defining what constitutes an "error" is a critical decision. Typically, any request that results in a
5xxHTTP status code is considered an error. You might also decide to include certain4xxcodes, depending on the context. - How it's measured: Like the request rate, this is also based on a
Counter. You can either have a separate counter for errors (http_requests_errors_total) or, more commonly, use a single request counter with alabelto distinguish outcomes. For example, yourhttp_requests_totalcounter could have astatus_codelabel. You can then query the rate for all requests where the status code is500,502, etc.
4. Duration: Measuring Latency and the Problem with Averages
Duration (or latency) measures how long your service takes to process a request. This is arguably the most important signal for user satisfaction, but also the most nuanced to measure correctly.
It's tempting to measure and plot the average latency. However, averages can be dangerously misleading. A single, extremely slow request (an outlier) can dramatically skew the average, while the experience for the majority of users might be fine. Conversely, a good average can hide a poor experience for a significant minority of users.
This is where percentiles become essential.
Percentile Tail Latency Explained (95%, 99%) Monitor Backend performance with this metric
To understand why percentiles are superior to averages for measuring latency, let's watch this excellent explanation from Hussein Nasser.
Watch the segment from 00:25 to 03:57. Focus on why average latency can be misleading and how percentiles like p95 and p99 provide a much clearer picture of what your users are actually experiencing.
As the video explained, percentiles tell a much richer story:
- p50 (Median): 50% of your requests are faster than this value. This tells you the experience of a typical user.
- p95: 95% of your requests are faster than this value. This is a common metric to track the "unhappy path" or tail latency. It represents the experience of a user on a slow connection or a request hitting an uncached resource.
- p99: 99% of your requests are faster than this value. This represents the worst-case experience for the vast majority of your users. SLOs (Service Level Objectives) are often set against p95 or p99 latency.
How it's measured: Percentiles cannot be calculated from simple counters. They require a more complex metric type called a Histogram. A histogram groups observations into configurable buckets (e.g., requests faster than 10ms, 25ms, 50ms, etc.) and maintains a total count and sum. The monitoring tool can then use this bucketed data to estimate any percentile.
5. Seeing RED in Action with Prometheus
Now that you understand the concepts, let's see how they are implemented and queried in a real-world monitoring tool like Prometheus.
The RED Method: How To Instrument Your Services [B] - Tom Wilkie, Kausal
This talk from Tom Wilkie, who created the RED method, explains the 'why' and shows how to instrument a service and query the metrics using Prometheus. The code is in Go, but the concepts are universal.
Watch the segment from 11:07 to 20:26. This is a dense but crucial part of the lesson. Pay close attention to: The definition of Rate, Errors, and Duration (11:07 - 12:58). How a single histogram metric can be used to capture all three signals using labels (12:58 - 16:24). The PromQL queries used to calculate Rate, Error Rate, and Latency Percentiles (histogram_quantile) (16:24 - 20:26).
From the video, we can summarize the key implementation points:
- Instrumentation: A piece of middleware is the perfect place to record metrics for every request.
- One Metric to Rule Them All: A single Histogram metric (e.g.,
http_request_duration_seconds) is powerful enough to provide all three RED signals.- Rate is derived from the histogram's total
_count. - Errors are distinguished by adding a
status_codeorsuccesslabel. - Duration percentiles are calculated from the histogram's
_buckets.
- Rate is derived from the histogram's total
- Querying (PromQL examples):
- Rate:
sum(rate(http_request_duration_seconds_count[5m])) - Error Rate:
sum(rate(http_request_duration_seconds_count{status_code=~"5.."}[5m])) - p99 Latency:
histogram_quantile(0.99, sum(rate(http_request_duration_seconds_bucket[5m])) by (le))
- Rate:

6. From Metrics to Action: Dashboards and Alerts
Collecting metrics is only half the battle. To make them useful, you need to visualize them on dashboards and configure alerts to notify you when things go wrong.
What is RED method? Meaning, Architecture, Examples, Use Cases ...
To make these metrics actionable, we build dashboards and set up alerts. This article provides excellent guidance on what these should look like for different audiences and how to think about alerting.
Read the section 'Recommended dashboards & alerts for RED method'. Focus on the distinction between Executive, On-call, and Debug dashboards, and the guidance on when an alert should page an engineer versus just creating a ticket.
This tiered approach to dashboards ensures that everyone from an executive to an on-call engineer can get the information they need at the right level of detail.
Conclusion
In this lesson, we explored metrics as the second pillar of observability. You learned how the RED method provides a simple, standardized framework for monitoring the health of any request-based service.
Key Takeaways:
- The RED method (Rate, Errors, Duration) is a focused approach for monitoring the health of backend services.
- Rate measures throughput and helps identify traffic anomalies. It is implemented with a
counter. - Errors measure the failure rate, a direct indicator of user-facing problems. It is also implemented with a
counter, often using labels. - Duration (latency) must be measured with percentiles (p50, p95, p99) to accurately reflect user experience, as averages can be misleading. Percentiles are calculated from
histogrammetrics. - A single histogram metric, enriched with labels, can be used to generate all three RED signals.
- These metrics are visualized on dashboards and used to trigger alerts, making them actionable.
Preview of the Next Lesson
The RED method tells us about the quality of the requests our service is handling. But it assumes our service is up and running. What if an application has crashed, is deadlocked, or is so overloaded it can't even respond?
In our next lesson, we will address this by learning how to implement liveness and readiness health check endpoints. These are simple, standardized APIs that orchestration systems like Kubernetes use to determine if a service instance is healthy enough to receive traffic or if it needs to be terminated and replaced. This will connect our observability knowledge directly to the automated management of our deployed applications.