Hello!
In our last lesson, we demystified CORS, exploring how this browser-enforced mechanism allows servers to relax the Same-Origin Policy. We saw how the conversation between client and server relies entirely on HTTP headers (Origin, Access-Control-Allow-Origin, etc.). So far, we've discussed these headers and requests in a theoretical sense. Now, it's time to learn how to see them in the wild.
Today's Goal: This lesson is all about practice. We'll learn how to use two indispensable tools to inspect and debug HTTP traffic: the browser's developer tools and the command-line utility curl. Mastering these tools is not just a "nice-to-have" skill; it's a fundamental requirement for any serious backend developer for testing APIs, diagnosing bugs, and understanding how web systems communicate.
Part 1: Visual Inspection with Browser Developer Tools
When you load a webpage, your browser might make dozens or even hundreds of HTTP requests behind the scenes to fetch HTML, CSS, JavaScript, images, and API data. The Network tab in your browser's developer tools is your window into this activity. It records every single one of these requests, giving you a complete picture of the communication.
Let's start by getting familiar with the layout and the wealth of information it provides.
Using the Chrome web developer tools, Part 2: The Network Tab
This article, 'Using the Chrome web developer tools, Part 2: The Network Tab', provides a great text-based introduction. It's important to know that you must have the developer tools open before the page loads to capture the traffic.
Please read the introduction and review the table of columns. Focus on understanding the purpose of key columns like 'Name', 'Method', 'Status', 'Type', and 'Timeline'. This will give you a solid map of the tool before we dive deeper.
Now that you have an overview of the columns, let's watch a video that walks through this in real-time, starting with a simple site and then moving to a more complex one.
Demystifying the Browser Networking Tab in Developer Tools With Examples
Hussein Nasser's video, 'Demystifying the Browser Networking Tab', is excellent for the deep technical dive you're looking for. We'll start with the basics.
Watch from the beginning up to 04:31. The presenter will show you how to open the Network tab and will inspect a simple request to example.org. Pay attention to how he identifies the HTTP method, status code, and the protocol (HTTP/1.1).
Dissecting a Real-World Page
Simple pages are great for learning, but the real value of the Network tab shines when analyzing complex applications. Modern web pages often pull resources from many different domains, involving redirects, multiple TCP connections, and different HTTP versions.
Let's continue the video to see an analysis of nginx.org. This will connect directly to concepts we've discussed, like HTTP protocol versions and connection management.
Demystifying the Browser Networking Tab in Developer Tools With Examples
This next segment of the video is dense with information that directly relates to your goal of understanding backend systems from the root.
Watch from 04:31 to 20:21. As you watch, look for the following: Multiple Resources: Notice how the initial HTML document triggers many subsequent requests for images, scripts, etc. Redirects: The presenter points out 307 and 302 redirects. We discussed these status codes in a previous lesson. Connection ID: This is a crucial column. Notice how requests to the same domain over HTTP/2 share a connection ID (due to multiplexing), while HTTP/1.1 requests often require separate connections. Protocol: See how different protocols (h2 for HTTP/2, h3 for HTTP/3/QUIC) are used for different domains (like Google and Facebook), depending on what the server supports.
Viewing the Raw HTTP Exchange
The Network tab provides a convenient, parsed view of headers. But remember, HTTP is just text. You can also view the raw text of the request and response headers.
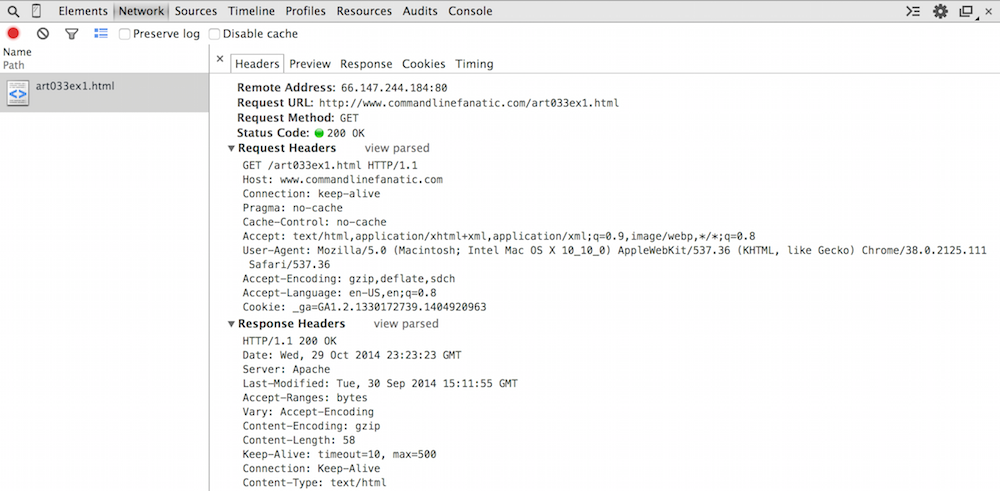
The ability to see exactly what the browser is sending is invaluable for debugging. For example, if you're troubleshooting a CORS issue, you can inspect the preflight OPTIONS request and verify that the Origin and Access-Control-Request-Method headers are what you expect.
Let's read a bit more about this detailed view.
Using the Chrome web developer tools, Part 2: The Network Tab
We'll return to the article on Chrome's Network Tab to understand the detailed header view and caching.
Read the sections that explain the 'Headers' view (including the raw view source option), how caching is reflected with 304 Not Modified status codes, and how POST requests appear with their form data payload.
Part 2: Surgical Strikes with curl
The browser's Network tab is fantastic for seeing how a full page loads, but as a backend developer, you often need to test a single API endpoint in isolation. You don't want to load a whole UI just to see if your /api/users/ endpoint is working correctly.
This is where curl (client for URLs) comes in. It is a powerful command-line tool that allows you to craft and send HTTP requests directly from your terminal, giving you complete control.
Let's start with a video that gives a great practical introduction to the most common curl commands.
cURL - The only HTTP client you'll ever need | Practical Bash & Terminal #9
The video 'cURL - The only HTTP client you'll ever need' provides a fast-paced, hands-on tour. We'll watch it in segments to focus on the key features.
Please watch the following segments: 00:00 - 02:01: Basic GET requests. 02:01 - 06:12: Making a POST request with a JSON body (-d) and setting the Content-Type header (-H). This is exactly what you'd do to test a Django REST Framework endpoint. 06:33 - 09:23: Using the verbose flag (-v) to see the full request and response, including all headers. This is the most important debugging flag. 11:29 - 14:09: Using -I to fetch only headers and -L to automatically follow redirects.
curl in Practice
Let's consolidate what we've seen into a few key patterns you'll use constantly.
-
Simple GET request (with headers):
# The -v (verbose) flag shows you the full request and response. # The > indicates lines sent by curl (the request). # The < indicates lines received by curl (the response). curl -v https://api.github.com/users/torvalds -
Testing a DRF POST endpoint:
# -X POST specifies the method. # -H sets a header. Here, we're telling the server we are sending JSON. # -d provides the request body data. curl -v -X POST \ -H "Content-Type: application/json" \ -d '{"username": "testuser", "email": "test@example.com"}' \ https://your-django-api.com/api/users/ -
Checking CORS headers:
You can simulate a browser's cross-origin request to see how your server responds.# We send an Origin header to mimic a request from a frontend application. # In the verbose output, you can then check for the Access-Control-Allow-Origin header in the response. curl -v -H "Origin: https://my-frontend-app.com" https://your-django-api.com/api/data/
For a comprehensive guide on curl, its own documentation is the best place to go. I encourage you to bookmark it for future reference.
The Art Of Scripting HTTP Requests Using curl
The official guide, 'The Art Of Scripting HTTP Requests Using curl', is a fantastic resource. We'll just read a few key sections that summarize the most important debugging techniques.
Please read the introduction ('See the Protocol') and the 'Debug' section. These reinforce the importance of --verbose (-v) and --trace-ascii for seeing the raw data, and provide a checklist for debugging when your curl request doesn't behave like a browser request.
Bridging the Gap: From Browser to curl
Here's a powerful trick that combines the two tools. If you see an interesting or problematic request in the browser's Network tab, you can right-click on it and select "Copy as cURL". This copies the exact curl command needed to replicate that browser request, including all headers, cookies, and data.
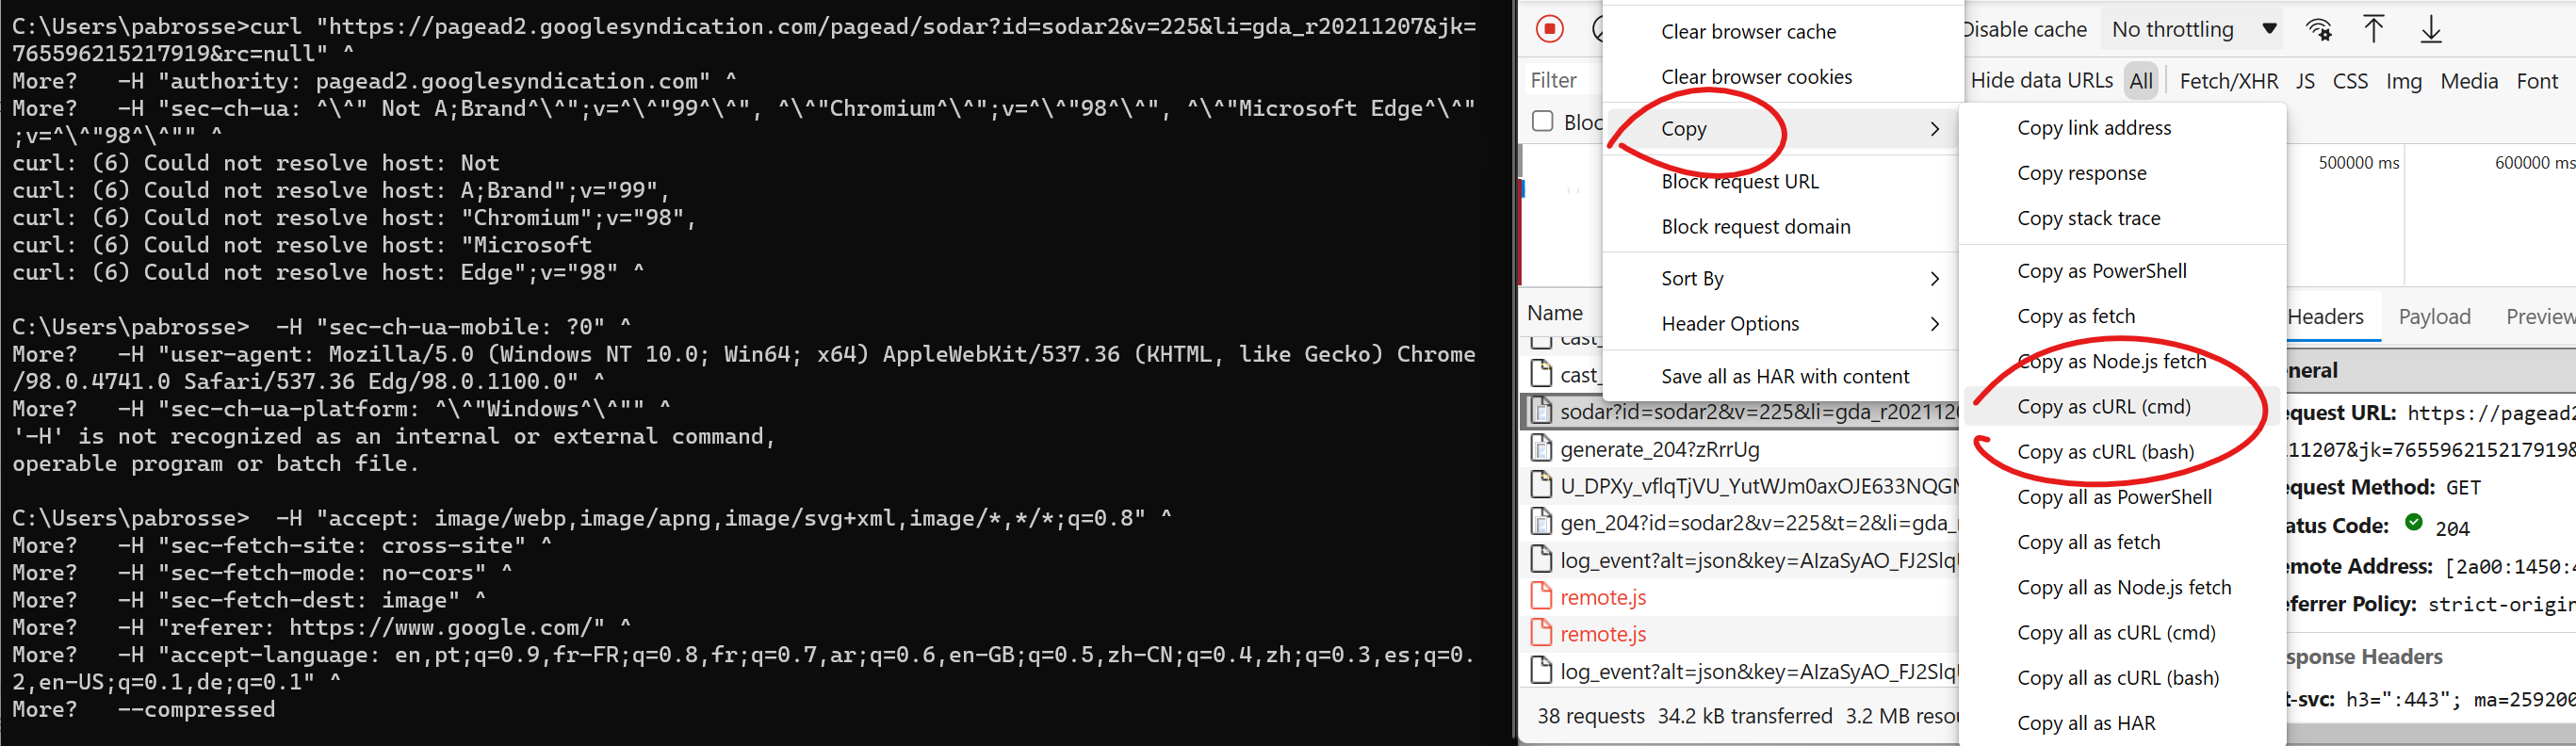
This is incredibly useful. You can paste the command into your terminal, see the result, and then start modifying it—removing a cookie, changing a header, altering the POST data—to pinpoint the cause of an issue.
Conclusion
You now have two powerful tools in your backend development toolkit. They serve different but complementary purposes.
Key Takeaways:
- Browser Developer Tools (Network Tab): Provides a high-level, visual overview of all network traffic for a webpage. It's best for understanding the big picture, analyzing page load performance, and seeing how multiple resources interact.
curl: A command-line tool for making precise, isolated HTTP requests. It's indispensable for backend developers for testing APIs, automating tasks, and debugging server-side logic without needing a browser.- The Debugging Workflow: A common workflow is to first observe a problem in the browser, then use "Copy as cURL" to replicate it in the terminal, and finally modify the
curlcommand to isolate and fix the issue.
Preview of the Next Lesson:
We have now concluded our deep dive into the application layer with HTTP. In the next module, we will move one layer down the stack to look at the Operating System. When you run your Django application with Gunicorn, it's the OS that creates and manages the server process. Our first lesson will be: "Define what a process is and the resources it encapsulates (memory address space, file descriptors)." This will be our first step in understanding how our backend code actually runs on a machine.