Welcome back. The previous lesson showed why ships concentrate in lanes through Hormuz without treating those lanes as the whole strait. Now the scale of the traffic matters: how much oil passes through, where it comes from, and where it goes. This lesson uses a dated chart and its accompanying data to distinguish two figures that often sound interchangeable—Hormuz’s share of worldwide oil consumption and its share of oil traded by sea. Allow about 40 minutes, including the readings.
Start with a date, a unit, and a time period
The U.S. Energy Information Administration (EIA) reports that oil flow through Hormuz averaged 20 million barrels per day in 2024. That is a rate averaged over a year, not a count of barrels on one particular day. Its category includes crude oil, condensate and petroleum products; it is not a figure for crude oil alone.
Study the EIA’s chart alongside its explanation. The article was published in June 2025, and its chart extends through the first quarter of 2025, marked 1Q25. A partial-year rate can be compared with an annual rate, but it should not be mistaken for an entire year’s observed traffic.
Read the EIA’s dated account for the chart, the 2024 average, and the two different measures of Hormuz’s importance.
On the June 16, 2025 article page, first examine the chart near the top, titled “volume of petroleum transported through the Strait of Hormuz”; note its unit and the label 1Q25. In the body below it, read the opening comparison, from the geographical description through the first-quarter comparison. Then, farther down in the same article, read the trend and shares. Focus on what changed between 2022 and 2024, and on the different denominators behind “one-fifth” and “more than one-quarter.”
The chart’s date matters. The EIA describes total flow in the first quarter of 2025 as relatively flat compared with 2024; that does not establish a rate for every later month. It also reports that, between 2022 and 2024, crude oil and condensate flow fell by 1.6 million barrels per day, partly offset by a 0.5-million-barrel-per-day rise in petroleum product cargoes. Thus, a fairly steady total can conceal changes in the kinds of oil being carried.
A world map can place that number in a wider shipping network, but it needs a different kind of care.
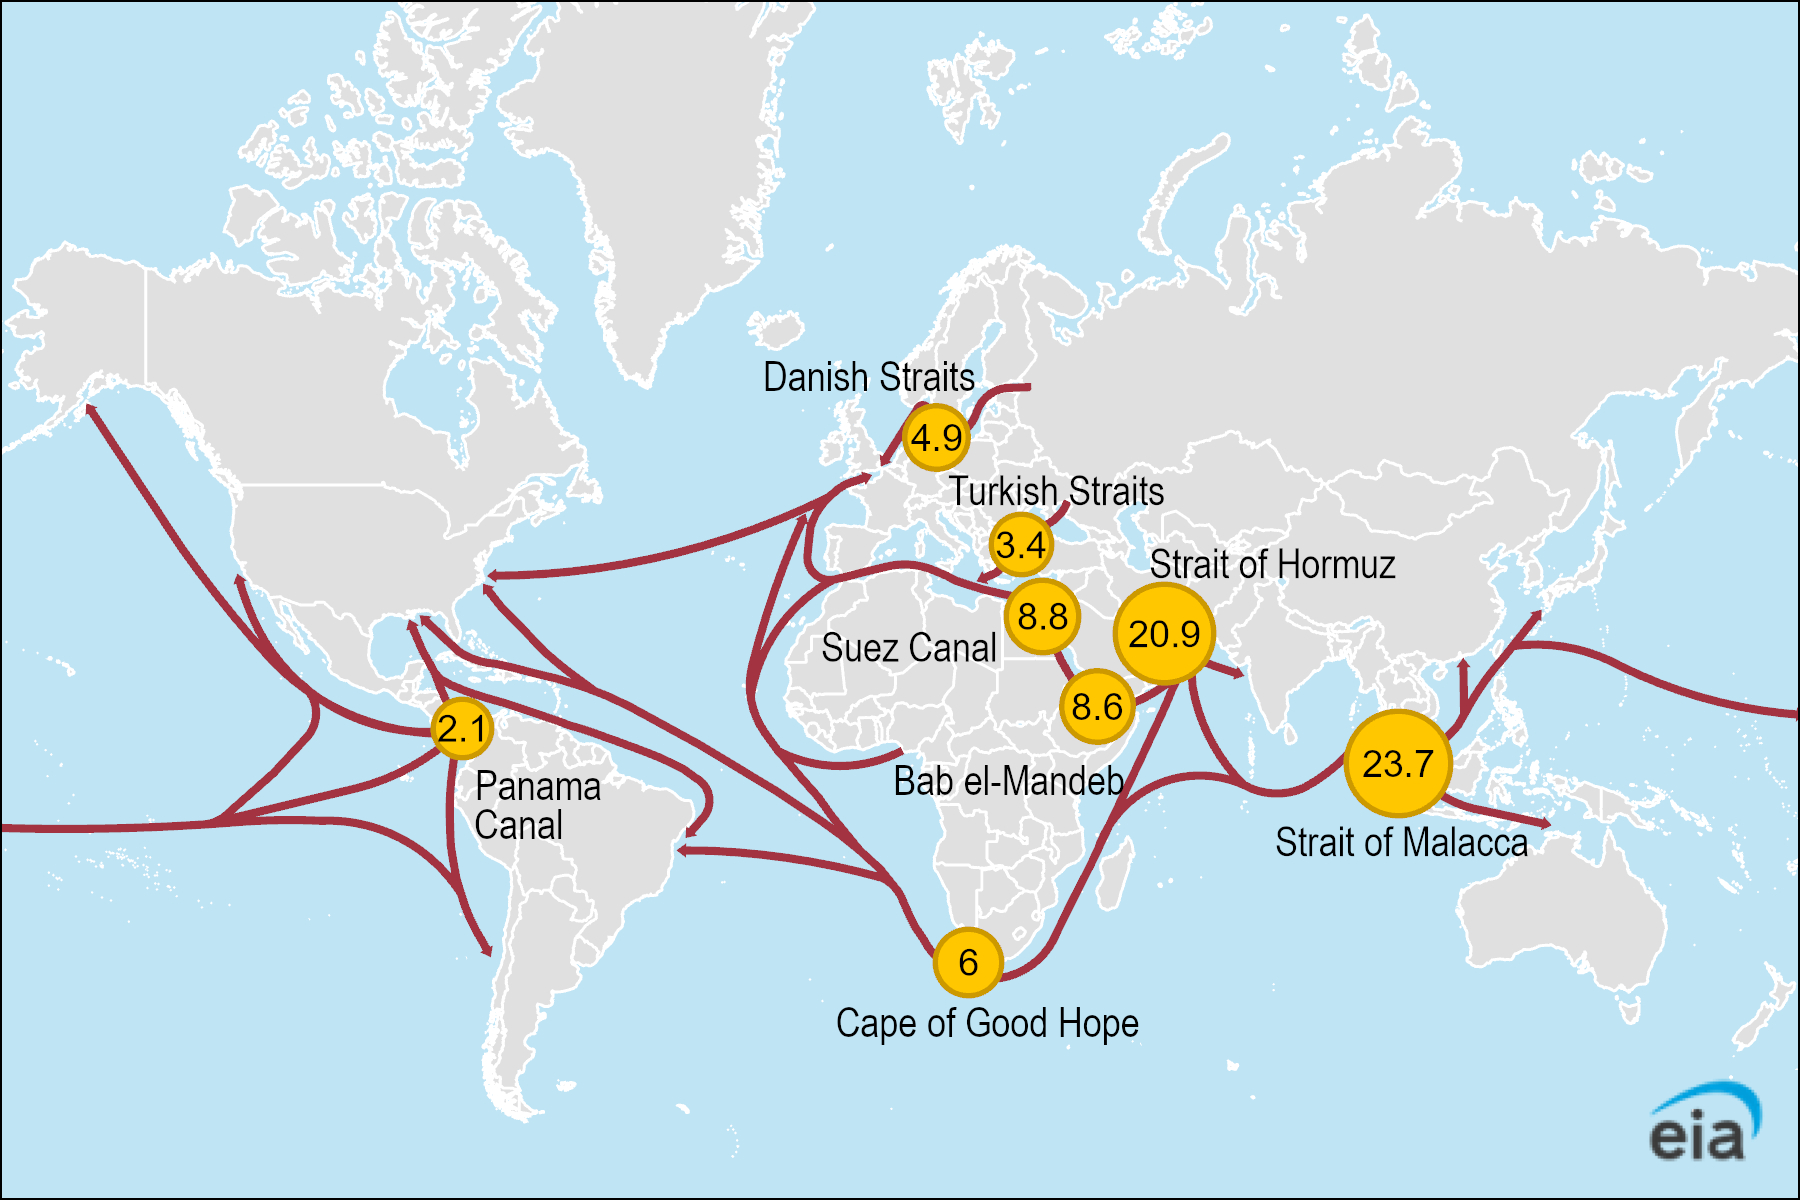
The routes on the map are connected. A cargo that passes Hormuz may later pass another marked location. Adding every label would therefore count some oil more than once. For a dated Hormuz estimate, use the 2024 figure in the article rather than assigning the map’s undated 20.9 to that year.
Follow the cargoes from exporters to destinations
The flow begins at ports around the Persian Gulf and continues through Hormuz toward overseas markets. The EIA identifies Saudi Arabia as the largest mover of crude oil and condensate through the strait in 2024: its exports accounted for 5.5 million barrels per day, or 38% of Hormuz crude and condensate flow. Kuwait and the United Arab Emirates are among the other Gulf exporters discussed in the article. The passage does not provide a full ranked list of every exporter, so the Saudi figure should not be extended into an invented ranking.
On the receiving side, the pattern is strongly Asian. The EIA estimates that 84% of crude oil and condensate passing through Hormuz went to Asian markets in 2024. China, India, Japan and South Korea were the leading named destinations; together they accounted for 69% of all Hormuz crude oil and condensate flow. The 69% is not a share of the 84%—both percentages use the total Hormuz crude-and-condensate flow as their base.
Return to the EIA article for its source-country and destination figures. Keep the type of oil attached to each percentage.
Below the first chart in this part of the article, read the paragraph immediately above the “Alternative routes” heading, beginning with the tanker-tracking finding about Saudi Arabia. Skip the “Alternative routes” section for now; a later lesson examines bypass capacity. Under the “Destination markets” heading, read the destination paragraph. In particular, locate the separate 84% and 69% statements and check which total each describes.
These figures describe routes and destination markets, not a claim that every barrel is consumed immediately upon arrival. They also do not say that Hormuz supplies 69% of China’s, India’s, Japan’s or South Korea’s individual oil needs. The EIA’s statement is about those four markets’ combined share of oil moving through Hormuz.
Notice one more category boundary: the 84%, 69% and Saudi 38% figures refer to crude oil and condensate. The 20-million-barrel-per-day headline refers to total oil flow, including petroleum products. Applying the crude-and-condensate shares directly to the total would mix categories.
Two large percentages, two different denominators
The EIA gives Hormuz’s 2024 oil flow as the equivalent of about 20% of global petroleum liquids consumption. It also says flow through Hormuz represented more than one-quarter of global seaborne oil trade in 2024. Both statements can be true because they compare the same route with different worldwide totals.
Worldwide consumption includes oil that does not cross an international sea route. Seaborne trade is a smaller pool, so Hormuz occupies a larger share of it. These percentages measure the route’s scale; they do not mean that a disruption would instantly remove 20% of oil available to consumers. The duration of an interruption, cargoes already at sea, inventories and possible alternative supplies would all matter.
The Saudi figure offers a second example of why denominators must stay visible. Dividing 5.5 million barrels per day by the reported 38% gives roughly 14.5 million barrels per day of Hormuz crude-and-condensate flow. That inferred subtotal is smaller than the roughly 20-million-barrel-per-day all-oil flow because the larger category also includes petroleum products. Both source figures are rounded, so the calculation is an approximation, not a new precise measurement.
A reliable reading of a Hormuz chart therefore carries four labels with every number: the year or quarter, barrels per day, the kind of oil counted, and the total used for any percentage. Without those labels, “a fifth of the world’s oil” may be a useful shorthand but is not a complete description.
Key takeaways
In the EIA’s 2024 figures, an average of 20 million barrels of oil per day moved through Hormuz. Saudi Arabia was the largest source of its crude oil and condensate flow, while Asian markets received most of that flow; China, India, Japan and South Korea were the leading named destinations. Hormuz carried the equivalent of about one-fifth of global petroleum liquids consumption, but more than one-quarter of global seaborne oil trade. The difference is the denominator, not a contradiction.
The next lesson follows a different cargo—Qatar’s liquefied natural gas—from production and loading through Hormuz to an overseas import terminal.