Hello! Welcome to the final lesson in our module on Advanced Theming & Performance Optimization.
In our previous lessons, we've focused on specific, high-impact optimization techniques: using modern image attributes and filters, and replacing the deprecated include tag with the performant render tag. These are the "how-to" of optimization.
Today, we'll address the crucial preceding step: the "what" and "where." You will learn how to analyze theme performance using Shopify's built-in tools and browser dev tools. This is about moving from "I think this is slow" to "I have data showing this specific Liquid loop is adding 300ms to my server response time." For a developer, this data-driven approach is fundamental to diagnosing and proving the value of your work.
We'll cover two primary domains of performance analysis:
- Front-end Performance: How the user perceives the site's speed, measured by Google's Core Web Vitals.
- Back-end Performance: How efficiently your Liquid code is rendered on Shopify's servers.
Mastering these tools will allow you to systematically identify bottlenecks, apply the optimizations we've discussed, and measure the improvement.
1. Understanding Modern Web Performance: Core Web Vitals
For a long time, "site speed" was represented by a single, often ambiguous, score from tools like Google Lighthouse. Shopify is moving towards a more nuanced and user-centric model based on Core Web Vitals (CWV), which are the key metrics Google uses as a search ranking factor.
This shift is important because the new metrics are based on Real User Monitoring (RUM)—data collected from actual visitors to a store, not a single test from a server. This provides a much more accurate picture of performance.
The following video provides an excellent introduction to Shopify's Web Performance dashboard and the three Core Web Vitals.
Intro to Shopify Speed Optimization 2024 - The New Performance Dashboard & Core Web Vitals
Watch this clip from Ed Codes to understand the 'why' behind Shopify's new performance dashboard and the three key metrics that define user-perceived performance.
Watch the first 6 minutes of the video. Focus on the differences between the old Lighthouse score and the new Core Web Vitals, and why CWVs are a more meaningful metric for both user experience and SEO.
To summarize the key concepts from the video, performance is broken down into three pillars:
- Loading Speed (Largest Contentful Paint - LCP): Measures how long it takes for the largest visual element on the page (usually the hero banner or product image) to become visible. This is directly affected by image size and theme structure. A good LCP is under 2.5 seconds.
- Interactivity (Interaction to Next Paint - INP): Measures the time from a user interaction (like a click or tap) to the next visual change on the screen. A slow INP leads to a feeling of sluggishness. This is often impacted by heavy JavaScript or slow-responding apps. A good INP is under 200 milliseconds.
- Visual Stability (Cumulative Layout Shift - CLS): Measures how much the content unexpectedly moves or "shifts" during page load. This is a major source of user frustration, often caused by ads, pop-ups, or app content loading in after the initial page render.
As a developer, your goal is to keep these three metrics in the "Good" (green/blue) zone. Now, let's look at the tools you'll use to measure and debug them.
2. Front-End Analysis: Using Google Lighthouse
While the Web Performance Dashboard uses real user data, it's a lagging indicator. For active development, especially on a development store with no traffic, you need a tool for proactive analysis. This is where Google Lighthouse, built directly into Chrome DevTools, comes in.

You can run a Lighthouse audit to get an immediate performance score and detailed recommendations. To ensure your results are comparable to Shopify's internal benchmarks (e.g., for theme store submission), you should follow a specific process.
Performance best practices for Shopify themes
This official Shopify documentation outlines the process for running a Lighthouse audit that emulates Shopify's own testing environment. This is a critical skill for professional theme development.
Read the section 'Run a Lighthouse audit using Shopify data'. You don't need to perform the steps right now, but understand the process: creating a dev store, importing test data, getting a preview URL, and running the report.
The Lighthouse report will give you a performance score from 0-100 and flag specific issues contributing to poor LCP, INP, or CLS. It might suggest compressing images, reducing unused JavaScript, or eliminating render-blocking resources—all actionable feedback you can use to apply the optimization techniques we've learned.
Test your understanding!
A merchant reports that their homepage feels "jumpy" while loading. An announcement bar and a reviews widget appear a moment after the main content, causing the page to reflow. Which Core Web Vital is being negatively affected, and what would a Lighthouse audit likely report as a contributing issue?
Show answer
The Cumulative Layout Shift (CLS) is the affected metric. The "jumpiness" is a classic layout shift issue. A Lighthouse audit would likely flag "Avoid large layout shifts" and point to the specific DOM elements (the announcement bar and reviews widget) that are being injected into the page and causing the content to move.
3. Back-End Analysis: Shopify Theme Inspector
Front-end performance is only half the story. The initial response time from Shopify's server, known as Time to First Byte (TTFB), is a critical factor that directly impacts LCP. A slow TTFB is often caused by inefficient Liquid code.
To diagnose this, Shopify provides a powerful Chrome extension: the Shopify Theme Inspector. This tool generates a "flame graph" that visualizes exactly how long each part of your Liquid code—templates, sections, snippets, and loops—takes to render on the server.
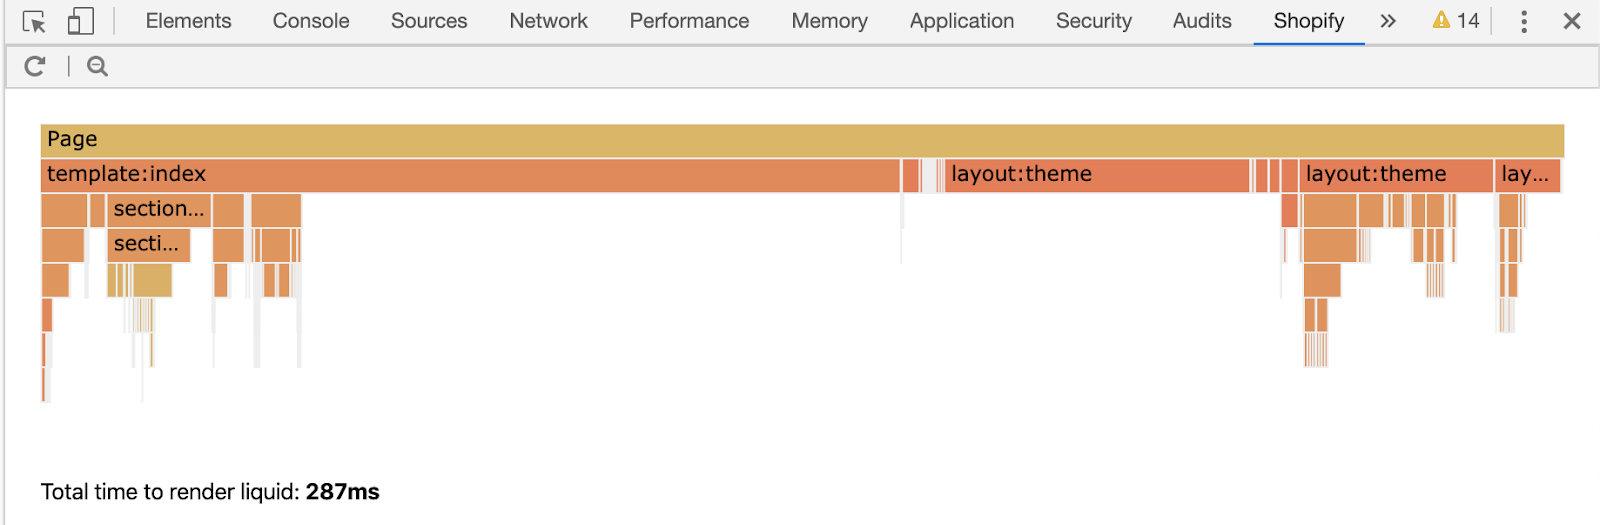
First, watch this quick demo to see the tool in action.
Shopify Theme Inspector for Chrome Demo
This brief video from ShopifyDevs demonstrates how to access and use the Shopify Theme Inspector to generate a performance profile.
Watch from 01:18 to 02:07. This will show you how to open the inspector, load a profile, and get a high-level view of the flame graph.
Now that you've seen what it does, let's dive into how to interpret its output to find real-world performance problems.
Identify Liquid render issues using Shopify Theme Inspector
This documentation provides the details on reading the flame graph and, most importantly, what common performance anti-patterns to look for.
Please read the sections 'Understanding the flame graph', 'Sandwich view', and 'What to look for when debugging'. Pay close attention to the examples of complex operations inside loops and deeply nested nodes.
The key takeaways from the documentation are:
- Look for long bars: A single long bar indicates one specific, slow operation. This might be a complex snippet or a section with a lot of logic.
- Look for many repeated, short bars: As the documentation notes, the "Sandwich view" is great for this. Hundreds of tiny, fast calls within a loop can add up to significant render time. This is often where you'll find inefficient loops that can be refactored.
- Connect to your code: The inspector tells you the exact file and line number, so you can jump directly from the bottleneck in the graph to the problematic code in your editor. This makes the debug-and-fix cycle incredibly fast. This tool would have clearly shown the performance difference between a loop using
includeversus one usingrender.
Conclusion
You now have a complete toolkit for performance analysis. You understand the high-level business and user-centric metrics (Core Web Vitals) and have two powerful, practical tools to diagnose issues on both the front-end and the back-end.
Key Takeaways:
- Performance is User-Centric: Focus on improving the three Core Web Vitals—LCP, INP, and CLS—as they reflect real user experience and impact SEO.
- Use Lighthouse for Proactive Analysis: Regularly run Lighthouse audits on your development theme to catch front-end performance regressions before they reach production.
- Use Theme Inspector for Liquid Bottlenecks: When your site feels slow to start loading (high TTFB), use the Shopify Theme Inspector's flame graph to find and fix inefficient Liquid code.
- The Workflow: Your process should be a continuous loop: Analyze with tools -> Identify bottlenecks -> Optimize the code (e.g., lazy load images, refactor a loop, use
render) -> Re-analyze to measure the impact.
This lesson concludes our module on advanced theming. You've learned to structure, customize, and optimize a Shopify theme from the ground up.
In our next lesson, we will begin a new journey into Shopify App Development. We'll start by exploring the fundamental question: when should you solve a problem with a theme customization, and when do you need to build a custom app? We will then introduce the powerful Admin APIs that allow you to extend Shopify's core functionality, opening up a new world of possibilities for your freelance projects.