Hello! Welcome back.
In our last lesson, you successfully deployed your web application from a GitHub repository to Render. This was a huge step, taking your project from your local computer to the live internet. However, a "Live" status in the deployment dashboard is only the beginning of the story. How do you know if the application really started correctly? And what do you do when it doesn't?
This lesson will teach you the crucial skill of post-deployment verification. We will cover how to read and interpret deployment logs to confirm that your application has launched successfully and how to use those same logs to diagnose and fix errors when something goes wrong.
What are Deployment Logs?
Every time you deploy your application, the cloud platform (like Render) performs a series of steps: it pulls your code, installs dependencies, and runs your start command. Each of these steps generates output, which is recorded in a chronological file called a log.
Think of logs as a diary kept by your application and the server it runs on. They tell you exactly what happened and when. There are two main types of logs you'll encounter:
- Build/Deployment Logs: These are generated during the deployment process. They show whether your dependencies were installed correctly and if the server started.
- Runtime Logs (or Application Logs): These are generated after deployment, while your app is running. They show incoming requests, errors that occur during operation, and any messages you program your app to print.
For today, we'll focus primarily on the build and deployment logs, as they are key to confirming a successful launch.
Confirming a Successful Launch
After you click "Create Web Service" or push a new commit, Render will start the deployment. You'll see a status like "In progress". After a few minutes, it should change to "Live".
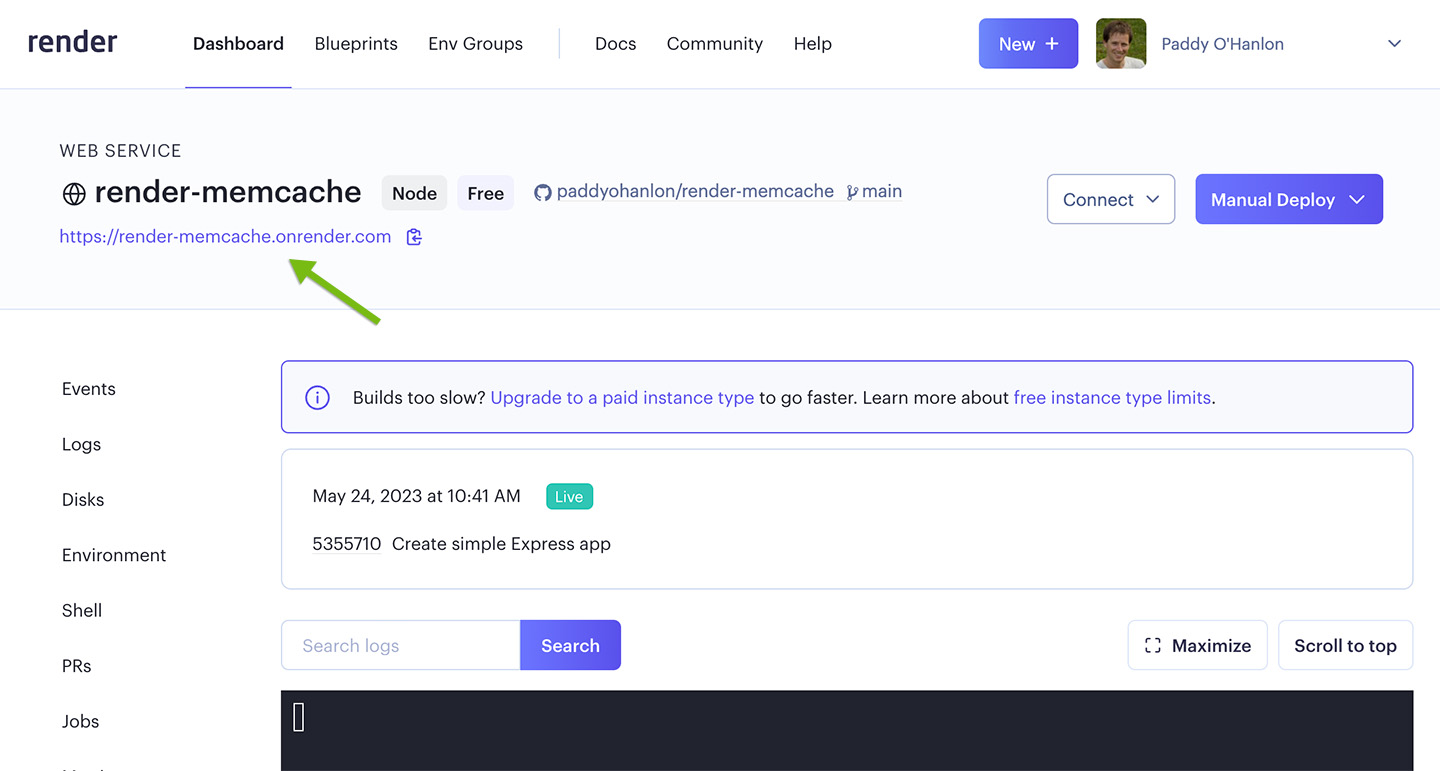
While "Live" is a good sign, it's not a guarantee that your application is healthy. The server might have started but then immediately crashed due to a code error. The real proof is in the logs.
Let's see what a successful deployment log looks like.
How to Deploy a Flask App to Render | Flask Render Deployment
This short clip from the 'How to Deploy a Flask App to Render' video shows what to look for right after a deployment is marked as 'Live'.
Watch from 09:45 to 10:35. Pay close attention to the log messages the presenter points out. You'll see messages about installing dependencies from requirements.txt and then the Gunicorn server starting up.
The key messages that confirm a successful start for our Flask application are from Gunicorn, our production server:
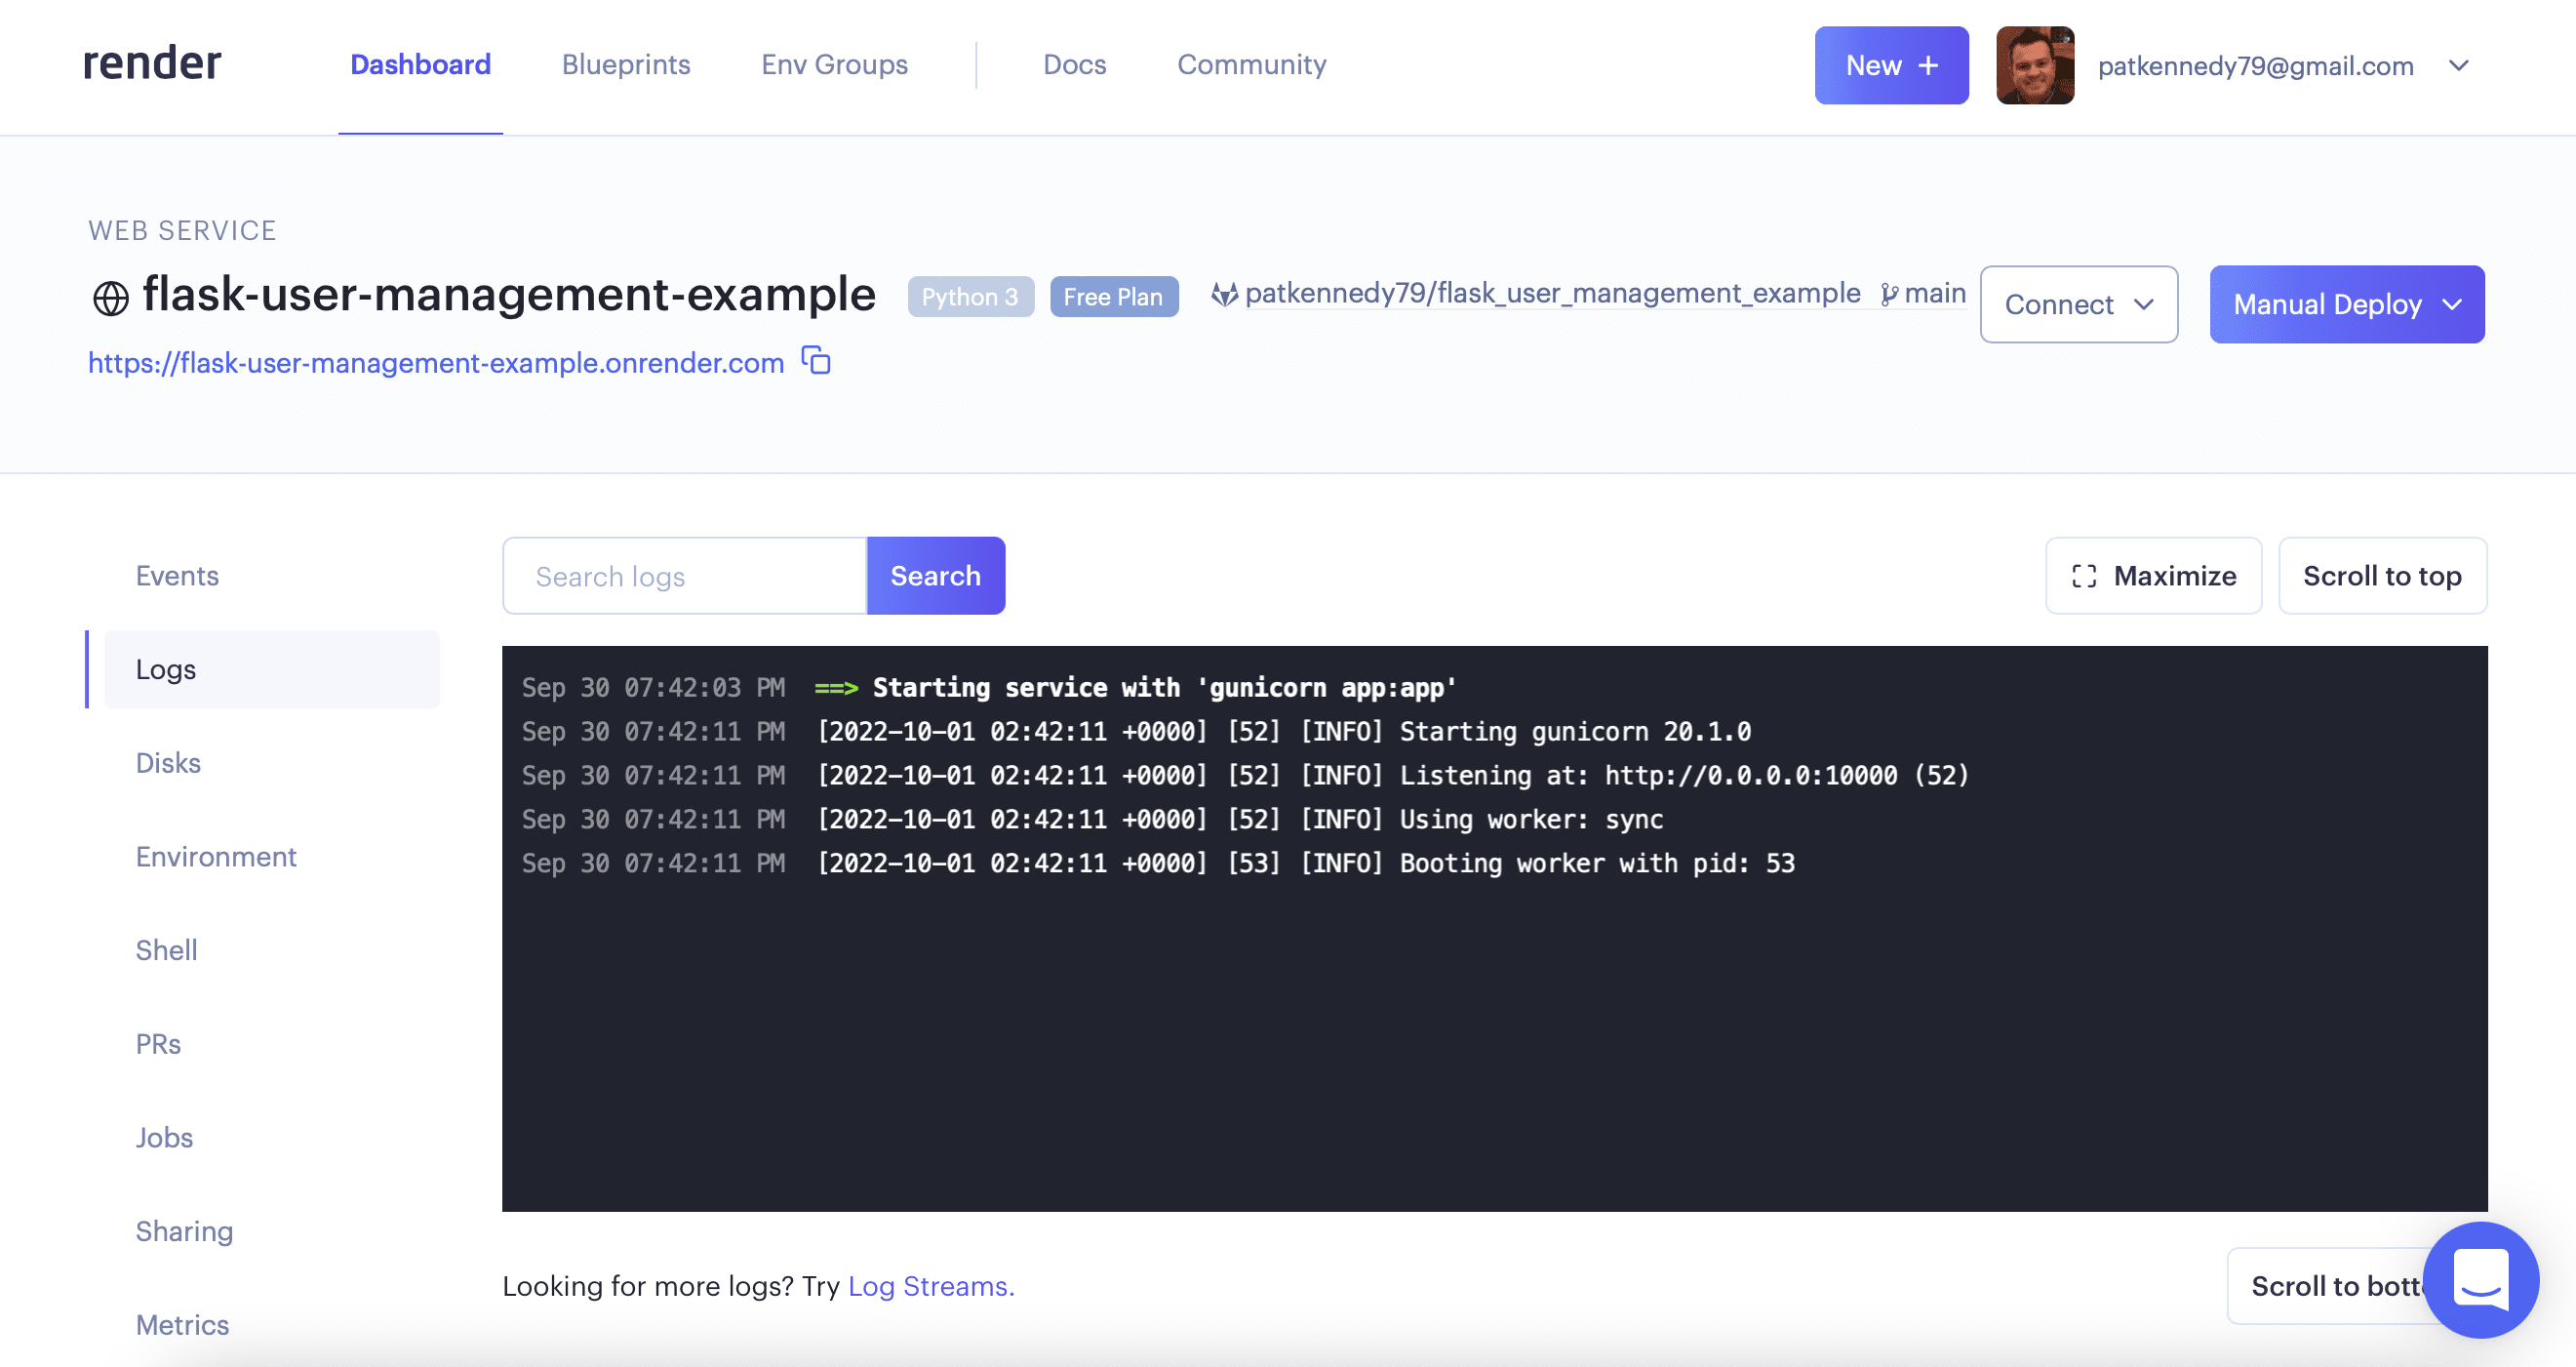
When you check your logs, you want to see lines like:
Starting gunicorn...Listening at: ...Booting worker with pid: ...
If you see these messages and no subsequent errors, it's a strong sign that your application has started correctly. The final confirmation is, of course, to visit the public URL and see your application working.
Diagnosing a Failed Launch with Logs
So, what happens when things go wrong? Your deployment might fail, or it might go "Live" but show an "Internal Server Error" page. This is where logs become your most important debugging tool.
Common reasons for deployment failure include:
- A typo in your
requirements.txtfile (e.g.,flsakinstead offlask). - A syntax error in your Python code (
app.py). - An incorrect Start Command in Render's settings.
- Forgetting to set a required environment variable (like your
GEMINI_API_KEY).
When a deployment fails, Render's logs will contain an error message that tells you exactly what went wrong. The process of debugging is a universal skill for developers, regardless of the platform.
Deploy Python Flask App on Pythonanywhere.com
Though this video demonstrates a deployment on a different platform (PythonAnywhere), it perfectly illustrates the universal debugging process: see an error, check the logs, find the cause, fix it, and redeploy. The principles are identical to what you'd do on Render.
Watch from 04:18 to 05:16. Notice how the presenter first encounters an error, then immediately goes to the 'error log'. The log clearly shows a NameError because of a misspelled package name. After fixing the typo and reloading, the site works.
On Render, the experience is very similar. If your app crashes, the logs will show a Python Traceback, which is a detailed error report pointing to the exact file and line of code that caused the problem.
Navigating Logs Effectively on Render
Render's logging interface is quite powerful. You don't have to read through thousands of lines to find a problem. You can search and filter to narrow things down.
To become proficient at debugging, it helps to understand the tools at your disposal. This official documentation from Render explains how to read and filter logs in their dashboard.
Please read the following sections from this document: Logs in the Render Dashboard: Get an overview of the log explorer. Inspecting a log line: Understand the components of a log entry (Level, Timestamp, Message). Log filters: This is the most important part. See how you can filter by level:error to quickly find problems. Logs for an individual deploy or job: Learn how to view logs for a specific deployment event.
The most useful filter you'll use is level:error. When your application isn't working, filtering by the error level will immediately show you the relevant crash reports or tracebacks, saving you a lot of time.
Test your understanding!
You just pushed a change to your code, and the new deployment on Render is "Live". However, when you visit your app's URL, you see a generic "Internal Server Error" message. What is the very first action you should take in the Render dashboard, and what are you looking for?
Show answer
Your first action should be to go to the Logs tab for your service in the Render dashboard. You should then filter the logs by typing level:error into the search bar. This will show you the specific Python Traceback or error message that is causing the application to fail.
Common Log Types
While Render provides a unified log stream, on many platforms (and in traditional server setups), logs are separated into different files. Understanding these categories is helpful context.
Deploying Flask sites on PythonAnywhere
This documentation from PythonAnywhere provides a great breakdown of the three standard log files you'll often encounter in web development. This will broaden your understanding beyond just the Render interface.
Find the section titled 'Logs' and read the short descriptions for the error log, server log, and access log. Pay attention to what kind of information goes into each one.
To summarize:
- Error Log: The most important for debugging. Contains application errors, tracebacks, and server startup messages.
- Server Log: Contains lower-level information about the server itself, like client disconnects.
- Access Log: A record of every single request made to your server (e.g.,
GET /index.html). This is useful for seeing traffic patterns and which pages are being requested.
Conclusion
You've now learned one of the most fundamental skills in web development: using logs to verify and debug your live application. You're no longer just deploying code; you're monitoring its health and are equipped to solve problems when they arise.
Key Takeaways:
- A "Live" status is not a complete guarantee of a working application.
- Deployment logs are your source of truth for what happened during the build and startup process.
- Look for Gunicorn's startup messages to confirm your Flask app has launched successfully.
- When an error occurs, the logs will contain a traceback or error message pointing you to the cause.
- Use filters like
level:errorin your hosting dashboard to quickly find critical issues.
Preview of the Next Lesson
Now that you can confirm your application is technically running, the next step is to ensure it works as intended from a user's perspective. In our next and final lesson of this module, we will cover how to perform a final test of the live, deployed application, making sure all features function correctly in the production environment.