Introduction
In our previous lesson, we established the fundamental roles of Query, Key, and Value vectors, which are created by projecting each input token's embedding through learnable weight matrices. We now have a "cast of characters" for each token: a Query that seeks information, a Key that identifies content, and a Value that provides the content.
This lesson drills into the heart of the attention mechanism: the interaction between the seeker and the identifier. We will explore how the model mathematically quantifies the relevance between any two tokens in a sequence. The central learning outcome is to explain precisely how the dot product between a Query vector and a Key vector serves as a measure of this relevance. This is the first computational step in determining how information should flow between tokens to build context.
The Dot Product as a Similarity Metric
From your background in linear algebra, you're familiar with the dot product as an operation that takes two vectors and returns a scalar. In the context of neural networks and embeddings, this operation takes on a new significance: it becomes a powerful, learnable measure of similarity or relevance.
Before we apply this to Queries and Keys, let's build the intuition for why the dot product is a suitable choice for measuring how "alike" two vectors are.
The math behind Attention: Keys, Queries, and Values matrices
The Serrano.Academy video, "The math behind Attention," provides an excellent introduction to using vector operations to measure similarity.
Please watch the segment from the start of the explanation on similarity. Focus on how the dot product between two word vectors in an embedding space can produce a high score for semantically similar words (like 'cherry' and 'orange') and a low score for dissimilar ones (like 'cherry' and 'phone'). The connection to cosine similarity is also very important here.
As the video illustrates, if vectors are constructed such that their directions in space represent semantic meaning, their dot product naturally captures their relationship. Vectors pointing in similar directions yield a large positive dot product, while orthogonal vectors (representing unrelated concepts) yield a dot product near zero.
The Geometric Interpretation of Relevance
To understand why the dot product works so well as a similarity score, we can turn to its geometric definition. The dot product of two vectors and is defined as:
where and are the magnitudes (or lengths) of the vectors, and is the angle between them.
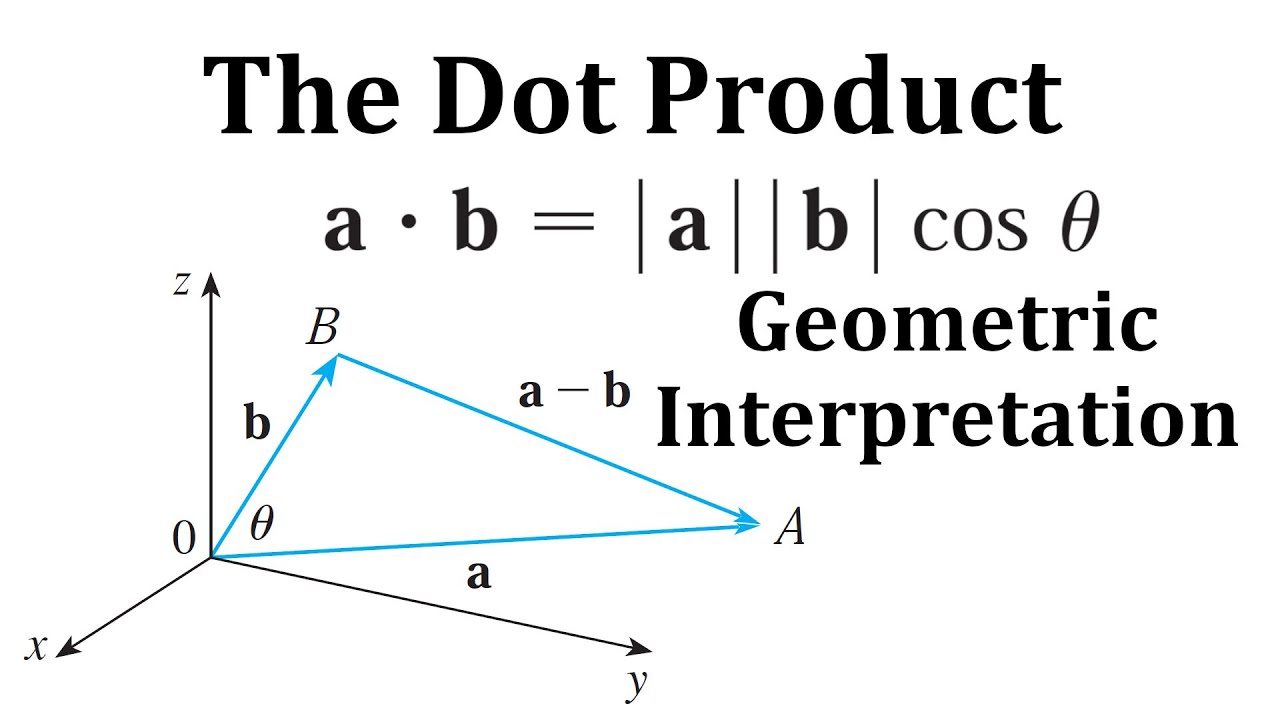
This image illustrates the geometric relationship between two vectors, a and b, their magnitudes, and the angle θ between them, which are the components of the dot product formula.
This formula reveals two key factors that influence the score:
-
Alignment (): This is the crucial part for measuring similarity.
- When vectors and point in the same direction, and , maximizing the score.
- When they are perpendicular (orthogonal), and , indicating no relationship.
- When they point in opposite directions, and , indicating they are antonyms or opposites.
-
Magnitude (): The lengths of the vectors also scale the score. This means that vectors with larger magnitudes can have a larger dot product, even if they aren't perfectly aligned. In the context of attention, magnitude can be interpreted as a measure of a token's importance or salience.
A very insightful way to interpret this is through the concept of projection. The term is the length of the projection of vector onto vector . Therefore, the dot product measures how much of vector lies in the direction of vector , scaled by the magnitude of .
Dot Product in the Attention Mechanism
This article by Eran Raviv provides a concise and clear explanation of the geometry behind using the dot product for similarity.
Please read the section titled "Dot Product and Vector Similarity." Pay close attention to the argument that connects the cosine function to our intuitive ordering of similarity and how the dot product formula can be interpreted in terms of vector projection.
Computing Relevance between Queries and Keys
Now we can apply this understanding directly to our Query () and Key () vectors.
- A Query vector represents token i asking a question, like "What action is being performed on me?"
- A Key vector represents token j advertising its properties, like "I am an action word."
The dot product, , calculates the raw attention score or relevance between these two tokens. A high score means the "question" asked by token i is well-answered by the "advertisement" from token j. The learned weight matrices and are trained specifically to project the initial embeddings into a subspace where this dot product reflects meaningful contextual relationships.
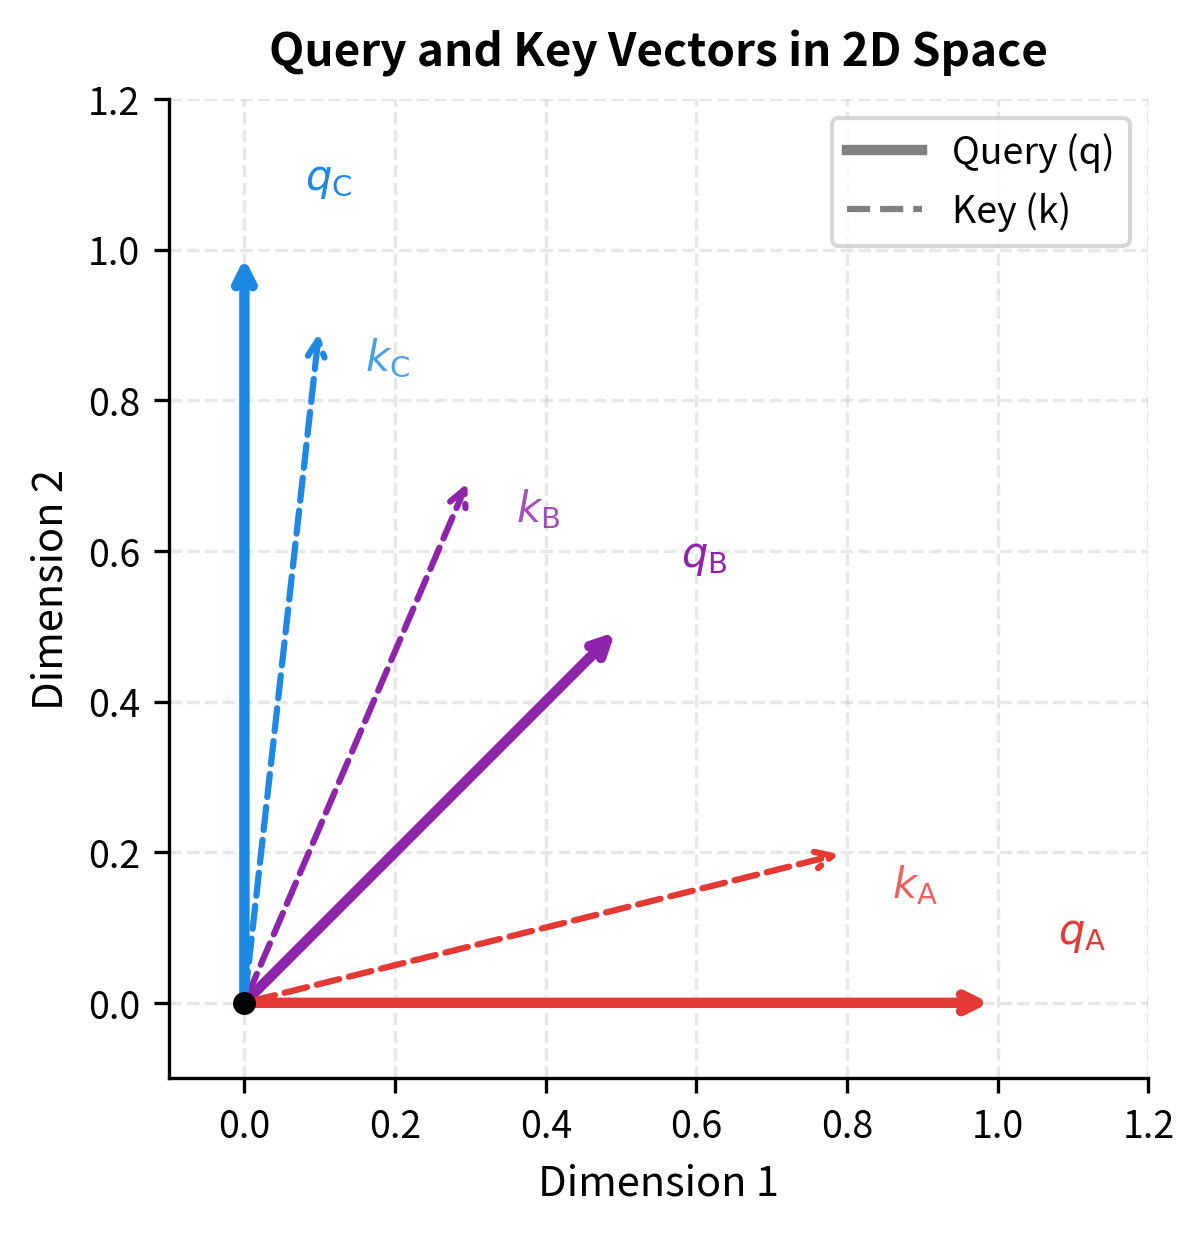
This plot visualizes how the alignment between Query (q) and Key (k) vectors determines their relevance. The pair (q_A, k_A) are closely aligned, suggesting a high dot product and high relevance. In contrast, q_A and k_C are nearly orthogonal, implying a low dot product and low relevance.
The following resources will solidify this final connection.
Understanding Scaled Dot-Product Attention in Transformers
This article provides a clear, step-by-step breakdown of how Query-Key dot products function in the attention mechanism.
Read the first part of the "Mathematical Breakdown" section. It explicitly discusses how vector alignment and angles between Q and K vectors determine attention scores.
To see this process in motion, let's return to the 3Blue1Brown video.
Attention in transformers, step-by-step | Deep Learning Chapter 6
The video "Attention in transformers, step-by-step" provides an animated visualization of how query and key vectors are generated and then used to calculate relevance scores.
Watch the segment from this section. It shows how the query matrix W_Q and key matrix W_K transform the embeddings, and how the dot product is then computed between query-key pairs to populate a grid of relevance scores.
For an entire sequence of tokens, this calculation is performed for every possible pair of Query and Key vectors. If we stack our vectors into matrices and of size , where is the dimension of the key/query vectors, we can compute all relevance scores simultaneously with a single matrix multiplication:
The resulting matrix is an matrix of raw, unbounded attention scores, where the element represents the relevance of token (as a key) to token (as a query).
Conclusion
In this lesson, we have focused on the fundamental mechanism for determining relevance in the Transformer. We've established that the dot product is not just an arbitrary choice but a geometrically and semantically meaningful operation for this task.
Here are the essential takeaways:
- The dot product between two vectors measures their similarity or alignment. Its value is influenced by both the angle between the vectors and their magnitudes.
- In the attention mechanism, the dot product is computed between the Query vector of one token and the Key vector of another.
- A high dot product indicates that the key is highly relevant to the query, signaling that the token associated with the key holds important information for the token associated with the query.
- This pairwise computation across all tokens results in a matrix of raw attention scores (), which represents the network's initial judgment about the contextual relevance of every token to every other token.
These raw scores are a crucial intermediate step, but they are not yet ready to be used as weights for combining the Value vectors. The scores are unbounded and do not form a proper distribution. In our next lesson, we will address this by introducing scaling and the softmax function to convert these raw relevance scores into the final attention weights, completing the scaled dot-product attention formula.