Introduction
Hello! Welcome to the next lesson in our module on performance tracking.
In our last session, we focused on the metrics inside your email marketing platform, like MailerLite. We learned how to interpret Open Rates and Click-Through Rates to understand how your subscribers are engaging with your emails. This gives you a clear picture of what happens before they click your affiliate link.
Today, we follow the customer's journey after the click. Once a potential customer clicks your affiliate link, they enter the ClickBank ecosystem. Understanding what happens there is critical to diagnosing problems and optimizing your campaigns for profitability.
This lesson will show you how to analyze ClickBank reporting data to see which links are getting clicks versus sales. We'll demystify ClickBank's terminology and show you how to read the reports to understand the difference between initial interest (a click) and strong purchase intent (viewing the order form).
From Clicks to Conversions: The ClickBank Funnel
In affiliate marketing, not all clicks are created equal. A person might click your link out of curiosity, but that's very different from being ready to enter their credit card information. ClickBank's reporting allows you to see this progression clearly through two key metrics:
- Hops: This is ClickBank's term for a click on one of your unique affiliate links (called a HopLink). Think of it as the first step—someone has been "hopped" from your content to the vendor's sales page.
- Order Form Impressions: This metric tracks how many people who "hopped" to the sales page then proceeded to click the "Buy Now" or "Add to Cart" button to view the actual payment form. This signals a much higher level of purchase intent.
The journey looks like this:
Your Content (Email/Blog) -> Hop (Click) -> Vendor's Sales Page -> Order Form Impression -> Sale
Understanding the numbers at each stage is the key to diagnosing where your affiliate funnel might be leaking. To get a quick overview of these metrics from ClickBank itself, please watch the following video clip.
How to Make Money with ClickBank in 2026 (Complete Beginner Tutorial)
This clip from a ClickBank tutorial introduces their analytics dashboard and defines the key terms we'll be using today, including hops and order form impressions.
Please watch from 23:53 to 24:47. Focus on the definitions of Hops, Order Form Impressions, and Sales.
Navigating ClickBank's Sales Analytics
Now that you know the key terms, let's find them in your ClickBank account. ClickBank has a powerful reporting suite called Sales Analytics. It's broken down into three main views: Traffic, Checkout, and Earnings. For our purposes today, we will focus on the Traffic Report.
The following resource provides a step-by-step guide to accessing this report and defines the key data points you'll find there.
This official ClickBank support document explains how to use their Sales Analytics reports. We'll use it to learn how to access the Traffic Report and to get formal definitions for the metrics.
First, read the section 'How to View the Traffic Report' to understand the navigation steps. Then, carefully read the definitions in the following section for 'Hops,' 'Initial Impressions,' and 'Hop Conversion Rate.' Note that ClickBank now uses the term 'Initial Impressions' for what we've been calling Order Form Impressions.
As you read, you'll notice a few key definitions:
- Hops: The number of visitors driven by your affiliate link.
- Initial Impressions: The number of unique users who viewed the order form.
- Hop Conversion Rate: The percentage of initial sales generated per hop (
Initial Sales / Hops). This tells you how effectively your traffic turns into sales.
It's also helpful to know that ClickBank updated its terminology. What used to be called "Hop Count" is now "Hops," and "Initial Order Form Impressions" is now "Initial Impressions." Don't let the name changes confuse you; the concepts are the same. This is confirmed in the "Sales Analytics FAQ" on ClickBank's support site, which clarifies these changes.
Interpreting the Data: What Are the Numbers Telling You?
Knowing the definitions is one thing; using them to make decisions is what matters. By comparing Hops to Order Form Impressions, you can diagnose the health of your promotional efforts.
Let's look at an example. The table below shows affiliate reporting data for several different products.
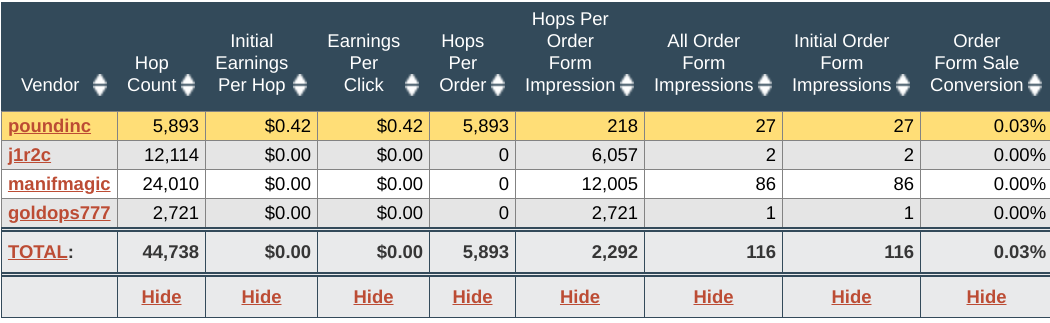
Take a look at the data in the image. You can see a significant difference between the vendors.
- The vendor
poundinchas generated earnings, indicated by the non-zero values in "Initial Earnings Per Hop" and "Earnings Per Click". - The other vendors, like
physgainsandvedalax, have generated hundreds or even thousands of Hops, but zero earnings.
This is where analyzing the funnel becomes powerful. Let's create a hypothetical scenario based on this kind of data:
Scenario 1: High Hops, Very Low Order Form Impressions
- Data: You sent 1,000 Hops to a product, but you only see 5 Order Form Impressions.
- Diagnosis: Your ad, email, or blog post is doing a great job of getting people to click! However, the vendor's sales page is failing to convince them to take the next step. The message on the sales page might not match what you promised, or the page itself might be low-quality, untrustworthy, or unpersuasive.
- Action: Consider finding a different product to promote, as you can't change the vendor's page.
Scenario 2: High Hops, Good Order Form Impressions, Low Sales
- Data: You sent 1,000 Hops, which resulted in 200 Order Form Impressions, but only 2 sales.
- Diagnosis: Your content is working, and the sales page is also effective at getting people to the finish line. The problem likely lies on the order form itself. Perhaps the price is higher than expected, there are unexpected shipping costs, or the form looks complicated or unsecure.
- Action: This product is promising because the sales page converts clicks to impressions well. It might be worth sticking with. The low final conversion could also be due to low-quality traffic, so you might analyze where your traffic is coming from.
This image shows another view from the analytics dashboard, including a graph of Hops over time.

The Key to Meaningful Analysis: Tracking IDs (TIDs)
So, how do you know if the Hops are coming from your email campaign or a review on your blog? This is where Tracking IDs (TIDs) become essential. As we covered briefly in a previous lesson, a TID is a small piece of code you add to your HopLink to label where the traffic came from.
For example, you could use these TIDs:
.../?tid=welcomeseries1for the first email in your welcome sequence..../?tid=prodreviewfor the main link in your product review blog post..../?tid=sidebarfor a banner in your website's sidebar.
By using TIDs, you can filter your ClickBank reports to see which specific links are driving Hops and which are driving sales. Without them, all your data is lumped together, making it impossible to know what's truly working.
The following video clip provides a quick refresher on how to add these parameters to your links.
How to Make Money with ClickBank in 2026 (Complete Beginner Tutorial)
Let's revisit the ClickBank tutorial to see a practical demonstration of how to add tracking parameters (TIDs) when you generate your HopLink.
Watch from 19:49 to 22:23. Pay attention to how TIDs and other parameters can be used to differentiate traffic from sources like YouTube vs. TikTok, or even different types of content.
Once you have TIDs in place, you can use the filtering options in the ClickBank Sales Analytics dashboard to isolate and analyze the performance of each specific campaign or piece of content.
Conclusion
You are now equipped to go beyond simply counting clicks and start analyzing the entire conversion funnel within ClickBank. By understanding the relationship between your promotional efforts and the results they generate, you can make informed decisions to stop what isn't working and double down on what is.
Key Takeaways:
- Hops are clicks on your affiliate link, representing initial interest.
- Order Form Impressions are views of the payment page, representing strong purchase intent.
- The gap between Hops and Order Form Impressions helps you diagnose whether the vendor's sales page is effective.
- The gap between Order Form Impressions and Sales can point to issues with pricing or the order form itself.
- Use the Traffic Report in ClickBank's Sales Analytics to find this data.
- Tracking IDs (TIDs) are essential for attributing performance to specific campaigns and making your analysis meaningful.
Preview of the next lesson:
In this lesson, we dissected the data within ClickBank. In the next, we'll start putting all the pieces together. We will learn how to use analytics data to identify an underperforming blog post. This will involve combining insights from Google Analytics (your traffic sources), your email provider (engagement), and ClickBank (conversions) to build a complete picture of your content's performance.