Welcome back! In our previous lesson, we established that under high driving potentials, the rate of an electrochemical reaction can become limited by how fast reactants can travel to the electrode surface. We defined this ceiling as the limiting current density, , and saw that it was inversely proportional to the thickness of the Nernst diffusion layer, . The major challenge we identified was that in a stationary solution, is unstable and not easily controlled, making it difficult to perform precise kinetic studies.
Today's lesson addresses this problem head-on. We will explore the rotating disk electrode (RDE), an elegant and powerful tool you have likely encountered in your own lab work. Our goal is to explain how the RDE provides precise control over mass transport, turning it from an unpredictable variable into a tunable parameter. Understanding this principle is fundamental to designing experiments that can accurately separate a catalyst's intrinsic kinetic performance from mass transport effects.
The Problem with Quiescent Solutions
To begin, let's briefly revisit why a stationary (quiescent) solution is problematic for quantitative kinetic analysis. In such a system, mass transport is governed by diffusion across a concentration gradient that extends from the electrode surface into the bulk solution. This diffusion layer grows over time and is easily disturbed by random thermal currents or vibrations, making the effective ill-defined and difficult to reproduce. This variability in mass transport introduces significant uncertainty, clouding our measurements of the underlying reaction kinetics at the electrode surface. To accurately assess a catalyst, we need to untangle these two contributions.
The RDE Solution: Controlled Hydrodynamics
The RDE solves this problem by introducing forced convection in a highly predictable and controllable manner. The setup consists of a disk-shaped electrode embedded in an insulating shroud, which is rotated at a constant, high speed (typically hundreds to thousands of RPM).
How to determine the mass transport limiting current in RDE
This short video from Pine Research, a major manufacturer of RDE equipment, provides an excellent conceptual introduction. It contrasts the transient, diffusion-limited current in cyclic voltammetry with the steady-state, convection-limited current achieved with an RDE.
Watch the segment from the introduction, which explains how rotation changes the mass transport regime and the resulting shape of the current-potential curve.
As the disk rotates, its motion imparts a force on the adjacent fluid. Due to viscous drag, the fluid is pulled axially toward the center of the disk and then flung radially outward. This creates a highly defined, laminar flow field.
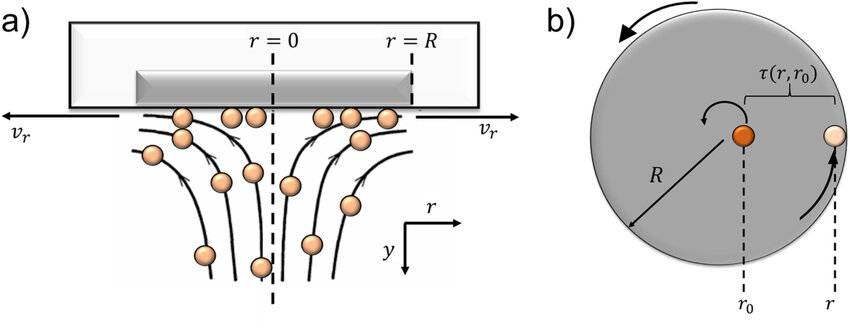
Your background in chemical engineering gives you a solid foundation for understanding fluid dynamics. The key insight here is that this specific flow pattern establishes two important and distinct boundary layers near the electrode surface.
Rotating Disk Electrode (RDE) Theory
This article from Pine Research provides the theoretical basis for how an RDE functions. It clearly defines the hydrodynamic and diffusion boundary layers.
In the "General Theory" section, please read from the paragraph beginning "The laminar flow". This passage explains the two key layers and gives the equations that govern their thickness.
As you just read, the two layers are:
-
The Hydrodynamic Boundary Layer (): This is a relatively thick layer of solution that is "dragged along" by the rotating disk. Within this layer, the dominant mode of mass transport is convection. Its thickness is given by:
where is the kinematic viscosity of the fluid and is the angular rotation rate.
-
The Diffusion Boundary Layer (): Immediately adjacent to the electrode surface, the fluid velocity approaches zero. In this very thin sub-layer, mass transport is dominated by diffusion. This is the layer that acts as the effective Nernst diffusion layer in an RDE system. Its thickness is precisely defined by the hydrodynamics:
Here, is the diffusion coefficient of the reactant.
The crucial takeaway is that the RDE replaces the unstable, growing diffusion layer of a quiescent solution with a thin, uniform, and time-independent diffusion layer whose thickness () is precisely controlled by the rotation rate (). Specifically, increasing the rotation speed makes the diffusion layer thinner (), which enhances the rate of mass transport to the surface.
Quantifying Mass Transport: The Levich Equation
Now we can connect this hydrodynamic control to the electrochemical measurement of current. In the last lesson, we established the relationship for limiting current density: . By substituting the RDE-controlled expression for , we arrive at one of the most important equations in electroanalytical chemistry: the Levich Equation.
Rotating Disk Electrode (RDE) Theory
Continuing with the same article, we will now look at the mathematical result of this controlled hydrodynamics.
Read the section that presents the Levich equation. Pay close attention to the variables involved.
The Levich equation for a cathodic (reduction) limiting current is:
This equation quantitatively describes how an RDE controls mass transport. It states that the mass-transport-limited current is directly proportional to the square root of the rotation rate ().
This relationship is exactly what you observe when performing linear sweep voltammetry (LSV) at different rotation speeds.
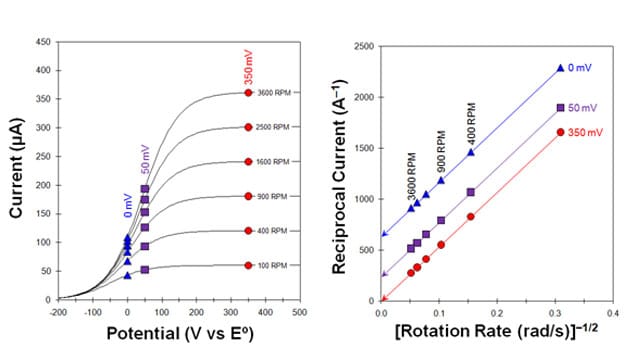
Notice in the left panel how the current in the initial rising portion of the curve (e.g., below 0 V) is nearly independent of rotation speed. This is the kinetically-controlled region, where the reaction rate is limited by the catalyst's activity, not by mass transport. However, at higher potentials, the curves plateau at a limiting current that systematically increases with the rotation rate, exactly as predicted by the Levich equation. This is the mass-transport-controlled region.
Electrochemistry (07-03) RRDE - Mass Trans Limiting Current1912
This video provides a clear walkthrough of how the polarization curve is divided into kinetic and mass-transfer controlled regions, and how rotation speed affects them.
Please watch the segment from this section. The speaker does an excellent job of explaining why the curves overlap at low potential but separate at high potential.
The Ultimate Goal: Isolating Reaction Kinetics
This brings us to the core purpose of using an RDE for your work in catalysis. By providing a known, tunable rate of mass transport, the RDE allows you to experimentally measure and subtract its contribution, thereby isolating the pure kinetic current (). This kinetic current represents the true, intrinsic activity of your electrocatalyst, free from mass transport artifacts.
The standard method for this is Koutecký-Levich analysis. The total measured current () is a combination of the kinetic current () and the mass-transport-limited Levich current (). Their relationship is given by the Koutecký-Levich equation:
Since the Levich current is proportional to , we can write , where is the Levich constant (the collection of terms ). Substituting this into the equation gives:
This equation has the form of a straight line, . By plotting the reciprocal of the measured current () against the reciprocal of the square root of the rotation rate (), we get a Koutecký-Levich plot. The y-intercept of this plot (where , corresponding to infinite rotation speed and thus infinite mass transport) gives the value of .
The right panel of the "Current-Potential Curves" image above shows exactly this: a Koutecký-Levich plot. By extrapolating the lines back to the y-axis, you can determine the pure kinetic current at each potential, a critical step in building a Tafel plot to analyze reaction mechanisms.
[PDF] Perspective - Chemistry - University of Alberta
This paper from ACS Nano is a practical guide to using techniques like RDE. It frames the "why" behind these measurements.
First, read the paragraph explaining why RDE is used to get a steady-state flux. Then, skim the section "DETERMINING THE STANDARD RATE CONSTANT (K0) USING A ROTATING DISK ELECTRODE" to see how the experimental data (like in the left panel of our image) is used to construct a Koutecký-Levich plot (like the right panel) to solve for the kinetic current.
Conclusion
In this lesson, we have demystified the operation of the rotating disk electrode. We've moved from the concept of an uncontrolled diffusion layer in a stationary solution to a precisely defined and tunable mass transport environment.
Key Takeaways:
- The RDE uses forced convection to create a stable, uniform diffusion boundary layer () whose thickness is inversely proportional to the square root of the rotation rate ().
- The Levich equation mathematically describes this control, showing that the mass-transport-limited current () is directly proportional to .
- This predictable control over mass transport is the key feature of the RDE. It allows researchers to distinguish between kinetic and mass-transport limitations.
- By performing measurements at various rotation rates, one can use Koutecký-Levich analysis to extrapolate to infinite mass transport and determine the pure kinetic current (), which reflects the catalyst's intrinsic activity.
Preview of the Next Lesson:
Now that you understand how an RDE controls mass transport, our next step is to put this knowledge into practice. In the following lesson, we will focus on interpreting RDE data. We will walk through the process of constructing Levich and Koutecký-Levich plots from experimental voltammograms to extract crucial parameters like diffusion coefficients and kinetic currents, further strengthening your ability to design and analyze your own electrocatalysis experiments.