Welcome back to our course. In the previous lesson, we delved into the non-Faradaic region of cyclic voltammograms to determine the electrochemically active surface area (ECSA). This gave us a crucial tool for understanding the physical properties of your catalyst materials. Now, we will shift our focus back to the Faradaic processes—the actual chemical reactions—and learn about the primary technique used to evaluate a catalyst's performance.
This lesson will introduce Linear Sweep Voltammetry (LSV). Our goal is to explain its working principle and its central role in evaluating electrocatalytic activity. For you, this technique is the workhorse for generating the polarization curves from which you assess the efficiency of your Ni-Fe/MXene catalysts for the hydrogen and oxygen evolution reactions. By the end of this lesson, you will understand how an LSV experiment is structured and how the resulting data provides a direct measure of a catalyst's performance.
The Working Principle of Linear Sweep Voltammetry
At its core, Linear Sweep Voltammetry is a beautifully simple technique. As the name suggests, the potential of the working electrode is swept linearly with time, but only in one direction—either from a starting potential to a final potential or vice versa. During this sweep, the potentiostat measures the resulting current that flows through the working electrode.
The following resource from Metrohm provides a clear explanation of this fundamental principle.
Understanding linear sweep voltammetry and cyclic ... - Metrohm
This article offers a concise introduction to LSV, contrasting it with the cyclic voltammetry we have already discussed.
Please read the introduction and the section on Linear sweep voltammetry. Pay close attention to Figure 1, which shows the two key plots associated with an LSV experiment.
As you just read, an LSV experiment is defined by two plots:
-
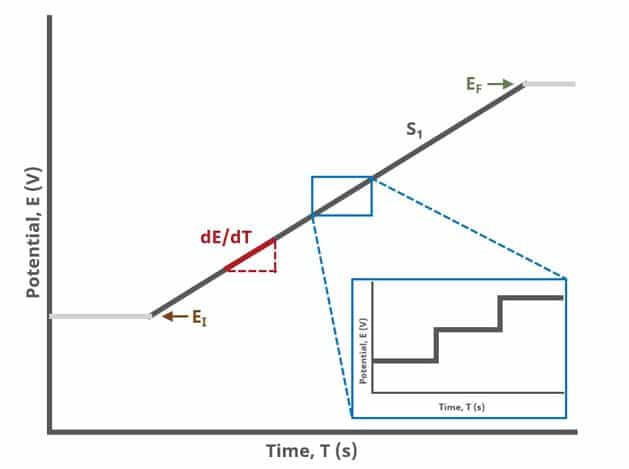
The Potential Waveform (E vs. t): This shows the potential applied to the working electrode as a function of time. It is a straight line, starting at and ending at . The slope of this line, , is the scan rate (), a critical experimental parameter you control.
-
The Voltammogram (i vs. E): This is the data you analyze. It plots the measured current () against the applied potential (). For electrocatalytic reactions like water splitting, this plot is often called a polarization curve.

Modern potentiostats generate this linear sweep using a series of tiny potential steps, creating a "digital staircase" that approximates a smooth ramp.
When and Why Use LSV for Electrocatalysis?
You might wonder why you would use LSV when Cyclic Voltammetry (CV) seems to provide more information by including a reverse scan. The choice depends entirely on the nature of the reaction and the information you seek.
Many electrocatalytic reactions, including the Hydrogen Evolution Reaction (HER) and Oxygen Evolution Reaction (OER), are highly irreversible under typical operating conditions. This means the reverse reaction (e.g., hydrogen oxidation or oxygen reduction) either doesn't happen at an appreciable rate in the same potential window or is not the focus of the study. In such cases, the reverse scan of a CV provides little to no useful information about the catalytic process of interest. LSV is therefore more direct and efficient.
The following video discusses the applications of LSV and clarifies its use for irreversible systems.
Comparative Study CV and LSV #cv #LSV #ELECTROCHEMISTRY
This video from the "Pioneer of Success" channel provides a comparative discussion of CV and LSV with practical examples.
Please watch the segment explaining why LSV is preferred for irreversible systems. Then, watch the example of an OER study, where LSV is used to compare the performance of three different catalysts for water electrolysis.
As the video demonstrates, LSV is the ideal tool for generating polarization curves to compare catalyst performance directly. By plotting the LSV curves of different catalysts on the same axes, you can immediately visualize which material produces more current at a given potential, indicating higher activity.
LSV in a Practical Catalyst Testing Protocol
Beyond its basic principle, understanding LSV means knowing its place within a comprehensive experimental plan. Your goal is to design robust experiments, and this requires a structured approach. LSV is rarely performed in isolation; it is part of a sequence of tests designed to evaluate a catalyst's activity, kinetics, and stability.
The following document, a draft of a European standard for testing HER electrocatalysts, provides an excellent example of such a protocol. It formalizes the "best practices" that researchers follow.
[PDF] Electrochemical characterisation at laboratory ... - CEN-CENELEC
This document outlines a rigorous testing methodology for HER electrocatalysts, showing how LSV fits into a larger experimental workflow.
First, briefly review the sequence of tests in the section Definition of parameters for assessing the electrode performance. Notice how LSV is used multiple times. Then, read the descriptions for Step 3 (Slow LSV) and Step 4 (Fast LSV). Focus on the different purposes of slow vs. fast scans.
This protocol illustrates a key aspect of experimental design. A slow scan LSV (e.g., 1-5 mV/s) is used to measure the intrinsic catalytic activity. The slow rate ensures the system is close to a steady state, minimizing contributions from capacitive charging currents (which you'll recall are proportional to scan rate, ) and allowing the Faradaic current to dominate.
In contrast, fast LSV scans, often run for hundreds of cycles, are used as an accelerated stress test to evaluate the catalyst's durability under dynamic conditions. By comparing the slow LSV curve before and after this cycling, you can quantify any loss in performance.
Interpreting the Polarization Curve
The polarization curve obtained from a slow-scan LSV is rich with information. It directly shows the relationship between the applied potential (the driving force) and the resulting current (the reaction rate). From this curve, we extract key metrics to quantify and compare catalyst performance. Two of the most important are:
- Onset Potential: The potential at which the catalytic reaction "turns on" and a noticeable current begins to flow. A lower onset potential (i.e., closer to the thermodynamic potential) signifies a more active catalyst.
- Overpotential (): This is the "extra" potential required beyond the thermodynamic equilibrium potential () to drive the reaction at a desired current density (e.g., 10 mA/cm², a common benchmark for solar fuel devices). It represents the kinetic barrier of the reaction. A lower overpotential at a given current density means the catalyst is more energy-efficient.
The following video provides a clear visual explanation of these concepts in the context of an OER experiment.
Tafel Slope and Overpotential from LSV | OER | Water Splitting | #electrochemistry
This video from ChemSimplified explains how key parameters are derived from an LSV curve for the Oxygen Evolution Reaction.
Watch the first part of the video which defines overpotential and onset potential. This will help you visualize where this information is on the polarization curve you've just learned how to generate.
The ability to extract these metrics is what transforms a simple LSV curve into a powerful tool for quantitative analysis. Your experience with OriginPro is directly applicable here, as you would use it to plot the data and determine the exact potential values corresponding to these metrics.
Conclusion
In this lesson, we have established the fundamental role of Linear Sweep Voltammetry in your field. You now understand not only its working principle but also its practical application in the rigorous evaluation of electrocatalyst performance.
Key Takeaways:
- LSV applies a linear potential sweep in one direction while measuring the current response, generating a polarization curve ( vs. ).
- It is the preferred technique for studying irreversible reactions like HER and OER, where the reverse scan is not needed.
- The resulting polarization curve provides a direct visual and quantitative measure of a catalyst's activity.
- Key performance metrics derived from the LSV curve include the onset potential and the overpotential () at a benchmark current density.
- LSV is a core component of standardized testing protocols, used for both initial activity measurements (slow scans) and durability testing (fast cycling).
Preview of the Next Lesson:
Now that you understand the principle behind generating an LSV polarization curve and the key information it contains, our next step will be to focus on the practical details of data analysis. In the next lesson, we will learn how to precisely extract the onset potential and overpotential at a benchmark current density from your LSV data, including the critical step of iR-correction.