Hello! Welcome to the final lesson of our first module on the thermodynamics of electrochemical systems.
Introduction
In our previous lesson, we calculated the minimum voltage required for water electrolysis, establishing the 1.23 V thermodynamic barrier. We saw how the Pourbaix diagram for water visually represents this potential difference as a "stability window" that is constant across the entire pH range.
Today, we will expand on that concept. You will learn how to interpret Pourbaix diagrams for other materials, specifically the metals used in your own research. This is a powerful skill that allows you to predict the thermodynamic stability of a material under different operating conditions.
The learning outcome for this lesson is to interpret Pourbaix diagrams to predict the thermodynamic stability of species in aqueous solutions. By the end, you'll be able to look at a Pourbaix diagram for a metal like nickel or iron and predict whether it will remain metallic, form a protective oxide layer (passivate), or dissolve (corrode) under the conditions of alkaline water electrolysis. This is a critical first step in understanding and designing stable electrocatalysts.
1. What is a Pourbaix Diagram?
At its core, a Pourbaix diagram is a map of thermodynamic stability. It shows which chemical species of an element is the most stable at a given electrode potential (E) and pH.
To get a feel for these diagrams, let's start with a short video that introduces the concept.
CHEM3006 - 30 - Pourbaix diagrams: what are they?
The video 'CHEM3006 - 30 - Pourbaix diagrams: what are they?' from Dylan Jayatilaka provides an excellent introduction to what these diagrams represent.
Please watch from the beginning to 03:24. Focus on: The axes of the diagram: Potential (voltage) vs. pH. The meaning of the 'regions' or 'countries' where a specific species is stable. The significance of the two blue lines representing the stability window of water, which you are already familiar with.
As the video explains, a Pourbaix diagram divides the potential-pH space into regions. Within each region, one species (e.g., Fe²⁺ ions, solid Fe₂O₃, or metallic Fe) has the lowest Gibbs free energy and is therefore the most stable thermodynamically. The lines separating these regions represent conditions where two species are in equilibrium.
This concept is vital for predicting catalyst stability. If your catalyst material is operating under conditions where it's not the most stable species, thermodynamics dictates that it will tend to transform into whatever is.
2. The Anatomy of a Pourbaix Diagram
The lines on a Pourbaix diagram are not random; they are calculated using the Nernst equation and represent three distinct types of chemical equilibria. Understanding what each line type means is the key to interpreting the diagram.
The following resource provides a concise explanation of these lines.
The Nernst Equation and Pourbaix Diagrams
This page from DoITPoMS at the University of Cambridge, 'The Nernst Equation and Pourbaix Diagrams', provides a clear framework for understanding the diagram's construction.
Please read the sections titled 'General expression of the Nernst Equation' and 'Anatomy of a Pourbaix Diagram'. You don't need to watch the embedded animations, but focus on the text explaining how the Nernst equation leads to the different line types.
Let's summarize the three types of equilibrium lines you'll encounter:
-
Horizontal Lines: These represent redox reactions that do not involve protons (H⁺) or hydroxide ions (OH⁻). The equilibrium depends only on potential, not pH.
- Example:
Fe²⁺ + 2e⁻ ⇌ Fe(s)
- Example:
-
Vertical Lines: These represent non-redox, acid-base reactions that do not involve electron transfer. The equilibrium depends only on pH, not potential.
- Example:
Fe²⁺(aq) + 2H₂O(l) ⇌ Fe(OH)₂(s) + 2H⁺(aq)
- Example:
-
Sloping Lines: These represent redox reactions that do involve H⁺ or OH⁻. The equilibrium potential depends on both potential and pH. The slope of the line is determined by the ratio of protons to electrons in the balanced reaction.
- Example:
Fe₂O₃(s) + 6H⁺(aq) + 2e⁻ ⇌ 2Fe²⁺(aq) + 3H₂O(l)
- Example:
The general form of the Nernst equation makes this clear:
Here, is the number of electrons and is the number of protons.
- If , the pH term disappears (horizontal line).
- If , the potential is not defined by this equation (vertical line, an acid-base equilibrium).
- If both and are non-zero, the potential has a linear dependence on pH (sloping line).
3. Application to Your Research: Ni and Fe Catalysts
Now, let's apply this knowledge to predict the stability of materials directly relevant to your work on bifunctional Nickel-Iron/MXene catalysts.
Your research is in alkaline seawater electrolysis. This means you are operating at high pH (typically 13-14) and are interested in two potential regions:
- OER Conditions (Anode): High, oxidizing potentials (e.g., > 1.23 V vs. RHE, which is approx. +0.4 V vs. SHE at pH 14).
- HER Conditions (Cathode): Low, reducing potentials (e.g., < 0 V vs. RHE, which is approx. -0.83 V vs. SHE at pH 14).
Let's examine the Pourbaix diagram for Nickel first.
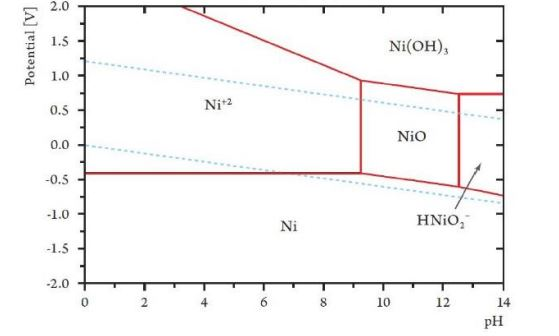
Your Turn (Nickel):
- Locate the high pH region (pH > 12) on the diagram.
- Under OER conditions (high potential, e.g., +0.6 V), what is the stable form of nickel?
- Under HER conditions (low potential, e.g., -1.0 V), what is the stable form of nickel?
Click to reveal interpretation
At pH 14: 1. Under **OER conditions**, at potentials above roughly +0.4 V, nickel is thermodynamically stable as various oxides and hydroxides like Ni(OH)₂, Ni₃O₄, and Ni₂O₃. It is *not* stable as metallic nickel. 2. Under **HER conditions**, at potentials below about -0.6 V, the stable form is metallic nickel (Ni).This implies that if you start with a metallic nickel catalyst, it is thermodynamically driven to transform into an oxide/hydroxide phase under OER operation. This transformed surface is often the true active catalyst for oxygen evolution.
Now let's do the same for iron.
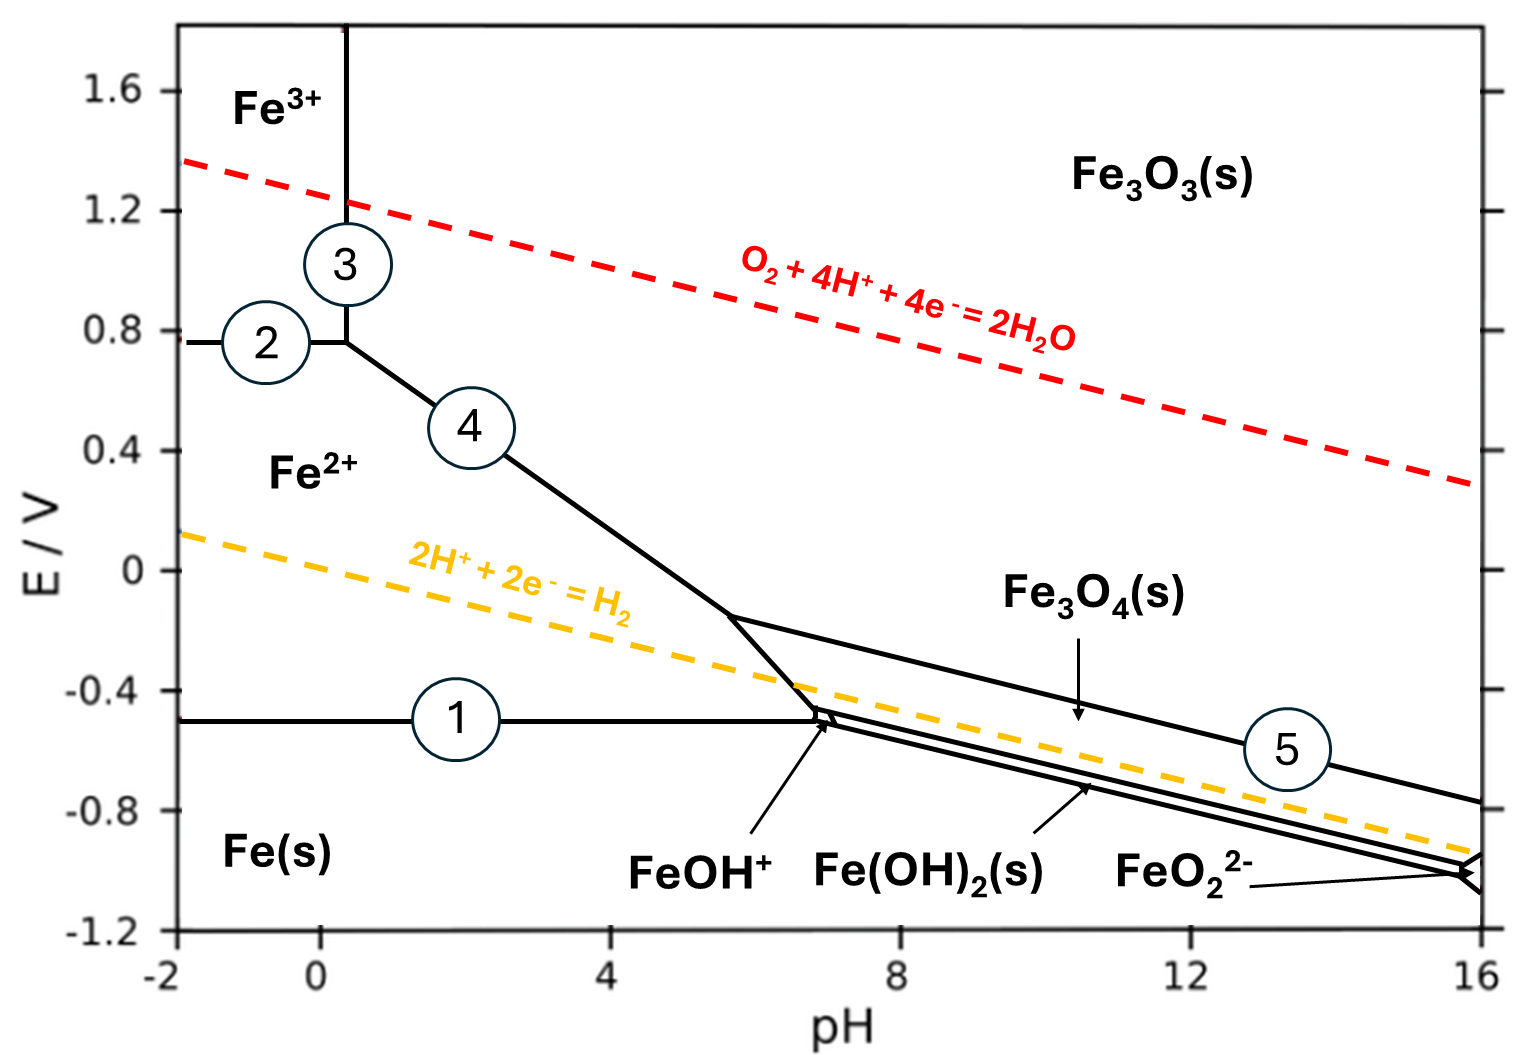
Your Turn (Iron):
- Again, locate the high pH region (pH > 12).
- Under OER conditions (high potential), what is the stable form of iron?
- What happens to iron if the potential gets very high (e.g., > +0.8 V)?
Click to reveal interpretation
At pH 14: 1. Under typical **OER conditions**, iron is stable as an oxide, Fe₃O₄, or a hydroxide, Fe(OH)₃ (also written as Fe₂O₃·3H₂O). 2. If the potential becomes very high, iron can form the soluble Ferrate ion (FeO₄²⁻), meaning the catalyst would dissolve into the electrolyte. This represents a corrosion and degradation pathway.These diagrams provide a powerful thermodynamic road map for understanding why Ni-Fe systems often form oxyhydroxides under OER conditions and why operating at excessively high potentials can lead to degradation.
4. Pourbaix Diagrams as a Predictive Tool in Modern Research
The interpretations you just made are not just academic exercises. They are at the forefront of catalyst design. Researchers now use computationally generated Pourbaix diagrams to forecast the stability of novel materials before ever synthesizing them in the lab. This is a key part of moving from trial-and-error testing to rational catalyst design.
The following perspective article from a leading research group discusses this exact approach.
[PDF] Redefining the Stability of Water Oxidation Electrocatalysts
The article 'Redefining the Stability of Water Oxidation Electrocatalysts' discusses the reality that many advanced catalysts are actually 'precatalysts' that transform under operating conditions. It highlights the use of computational Pourbaix diagrams as a predictive tool.
Please read these two key sections: 'LEARNINGS FROM COMPREHENSIVE MATERIALS DATABASES': Start from the paragraph beginning 'Besides interpreting empirical trends...' and read to the end of the section. Focus on how the authors use Pourbaix diagrams from the Materials Project to predict the stability of Co-based catalysts under OER and HER conditions. Notice the conclusion is the same as ours: oxides/oxyhydroxides form under OER. 'GUIDELINES FOR TM X-IDE OER ELECTROCATALYSIS RESEARCH': Read the first two paragraphs. Pay close attention to the recommendation that researchers should 'use Pourbaix diagrams and other computational analyses to predict the stability of their chosen... composition' before synthesis.
This article bridges the gap between the century-old concept of Pourbaix diagrams and your cutting-edge research. It confirms that under the highly oxidizing conditions of the OER, many transition metal compounds are thermodynamically unstable and transform into oxyhydroxide phases. Understanding this transformation, which is predicted by Pourbaix diagrams, is crucial for identifying the true active species and designing durable catalysts.
Conclusion
This lesson concludes our module on thermodynamics. We've gone from the fundamental relationship between Gibbs free energy and cell potential to using that knowledge to predict the stability of real-world catalyst materials.
Key Takeaways:
- Pourbaix diagrams are potential-pH maps that show the thermodynamically most stable species of an element in an aqueous solution.
- The lines on the diagram represent equilibria: horizontal for redox, vertical for acid-base, and sloped for reactions involving both.
- By superimposing the operating conditions (pH and potential) onto a Pourbaix diagram, you can predict whether a material is likely to be immune (stable metal), passivated (form a stable oxide), or corrode (dissolve as ions).
- For your work in alkaline electrolysis, Pourbaix diagrams predict that both nickel and iron will transform into oxide/hydroxide phases under OER conditions, which are widely believed to be the active catalytic species.
Preview of the Next Lesson:
We have now established the thermodynamic "what" and "why" of electrochemical reactions. In the next module, we will begin to explore the physical "where." Our first lesson will focus on the structure of the electrical double layer (EDL) at an electrode surface. This is the microscopic region at the interface between your catalyst and the electrolyte where charge accumulates and all the electrochemical reactions we've been discussing actually take place.