Welcome to the final lesson of our first module. Over the past three lessons, we've built a solid theoretical foundation, starting with the I/Q representation of signals, implementing basic QPSK and 8PSK modulators, and finally dissecting the advanced ring-based APSK constellations that are central to DVB-S2.
Today, we transition from theory to practice. Our objective is to generate and visualize I/Q constellation diagrams in GNU Radio using signal source and modulation blocks. This lesson is your hands-on introduction to GNU Radio Companion (GRC), the powerful software-defined radio tool we will use extensively throughout this course. By the end of this session, you'll be able to build a simple transmitter, see the constellation points you've been learning about, and observe the real-world effects of channel noise and other impairments.
Your First GNU Radio Flowgraph
GNU Radio is a free and open-source software development toolkit that provides signal processing blocks to implement software radios. Its companion application, GNU Radio Companion (GRC), offers a graphical interface for building these signal processing "flowgraphs" by connecting blocks. The basic paradigm is to connect a source block (which generates a signal or data), through one or more processing blocks (which manipulate the signal), to a sink block (which consumes or displays the signal).
We will now build a simple flowgraph to generate and visualize a QPSK signal. The GNU Radio Wiki provides an excellent tutorial that walks through this process. We will follow its logic closely.
QPSK Mod and Demod - GNU Radio Wiki
This tutorial provides the essential background and step-by-step logic for creating a QPSK modulator in GNU Radio. It explains the key blocks and their parameters, forming the basis of our hands-on work.
First, read the Background section to refresh your memory on how QPSK is represented in the I/Q plane. Then, read the section Transmitting a QPSK Signal. As you read, focus on understanding the roles of these three key components: Constellation Rect. Object: How it defines the QPSK points. Constellation Modulator: How it uses the object to map input bytes to complex symbols and applies pulse shaping. Pulse Shaping (Excess Bandwidth): Why an RRC filter is used and what the "trails" between constellation points represent.
Building the QPSK Transmitter in GRC
Now, let's translate the concepts from the reading into a working flowgraph. Launch GNU Radio Companion on your computer. You will see a blank canvas with an Options and a Variable block by default. On the right, there is a library of available blocks.
Follow these steps to build the transmitter:
-
Options Block: Double-click the
Optionsblock. Ensure theIDistop_blockandGenerate Optionsis set toQT GUI. This tells GRC to create a graphical application we can interact with. -
Variables: For good practice, we'll define key parameters as variables.
samp_rate: Set this to32k. This is our simulation's sample rate.sps(samples per symbol): Set this to4. Each symbol will be represented by 4 samples.excess_bw(excess bandwidth): Set this to0.35. This is the roll-off factor for our RRC pulse-shaping filter.
-
Random Source: Find the
Random Sourceblock (under Waveform Generators) and drag it onto the canvas. This will generate the data we want to transmit. Leave itsOutput TypeasByteand setMaximumto255. -
Constellation Object: Find the
Constellation Rect. Object(under Modulators) and add it. This block defines our modulation scheme.- Set its
IDtoqpsk. - Leave the
Constellation PointsandSymbol Mapat their defaults, which define a Gray-coded QPSK constellation.
- Set its
-
Constellation Modulator: Add a
Constellation Modulatorblock (under Modulators). This performs the modulation.Constellation: Set this toqpsk, the ID of the object you just created.Samples/Symbol: Set this to our variablesps.Excess BW: Set this to our variableexcess_bw.
-
Throttle: Add a
Throttleblock (under Misc). In a simulation without hardware, this block is essential. It controls the flow of data to prevent your CPU from running at 100%. Set itsSample Ratetosamp_rate. -
QT GUI Constellation Sink: Finally, add a
QT GUI Constellation Sink(under GUI Widgets). This is our visualizer. Leave its parameters at their defaults for now. -
Connect the Blocks: Connect the blocks by clicking the output port of one block and the input port of the next:
Random Source->Constellation Modulator->Throttle->QT GUI Constellation Sink.Notice the colors of the ports: magenta for byte streams and blue for complex floating-point streams. GRC enforces type checking, a very useful feature.
Your flowgraph should look similar to the one in the tutorial (though that one includes receiver components we haven't added yet). Now, save the flowgraph and click the "Generate" button (gear icon) followed by the "Execute" button (play icon).
A window should appear showing the constellation diagram. You should see four distinct clusters of points at the corners, but also lines connecting them. These lines represent the trajectory of the I/Q samples during the transition from one symbol to the next, shaped by the RRC filter. They are not errors; they are an inherent part of the filtered signal's representation.
Introducing Channel Impairments
The plot you see is for a perfect, noiseless channel. This is not representative of any real communication system, especially not a satellite link. To simulate a more realistic scenario, we will add a Channel Model block. This block allows us to introduce common impairments like noise, frequency offsets, and timing drift.
The image below shows a flowgraph very similar to the one we will now build. It includes the Channel Model block placed after the modulator.
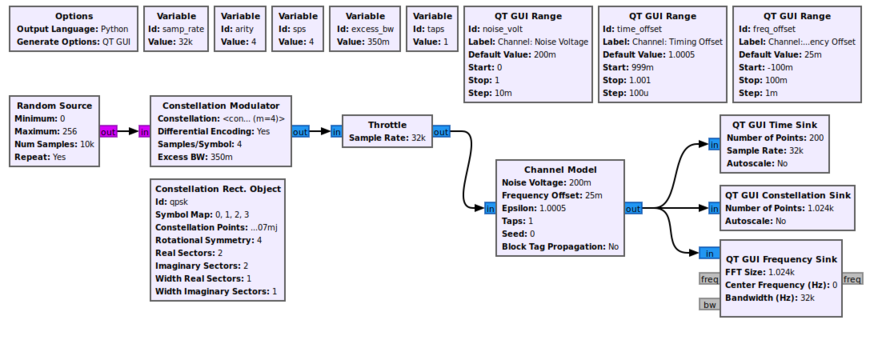
Let's modify your flowgraph:
- Delete the connection between the
Throttleblock and theConstellation Sink. - Add a
Channel Modelblock (under Channel Models). - Insert it between the
Constellation Modulatorand theThrottleblock. The new chain is:Constellation Modulator->Channel Model->Throttle->QT GUI Constellation Sink. - Double-click the
Channel Modelblock. Let's examine its key parameters:- Noise Voltage: This controls the amount of Additive White Gaussian Noise (AWGN). A value of
0is a noiseless channel. Start with a small value like0.1. - Frequency Offset: This simulates the carrier frequency difference between transmitter and receiver. It is specified as a fraction of the sampling rate. A small value like
0.01will cause the constellation to rotate. - Epsilon (Timing Offset): This simulates the sampling clock difference. Keep it at
1.0for now.
- Noise Voltage: This controls the amount of Additive White Gaussian Noise (AWGN). A value of
Now, execute the flowgraph again.
- With
Noise Voltageset to0.1(and others at zero), you will see the four points blur into "clouds." The higher the noise voltage, the larger and more diffuse these clouds become. - Reset
Noise Voltageto0and setFrequency Offsetto0.01. You will see the entire constellation diagram rotate continuously. This is what a receiver must correct for.
This simple exercise powerfully demonstrates why the receiver's job is so challenging. It doesn't receive clean points; it receives a noisy, rotating, and time-drifted cloud of samples and must recover the original symbols from it.
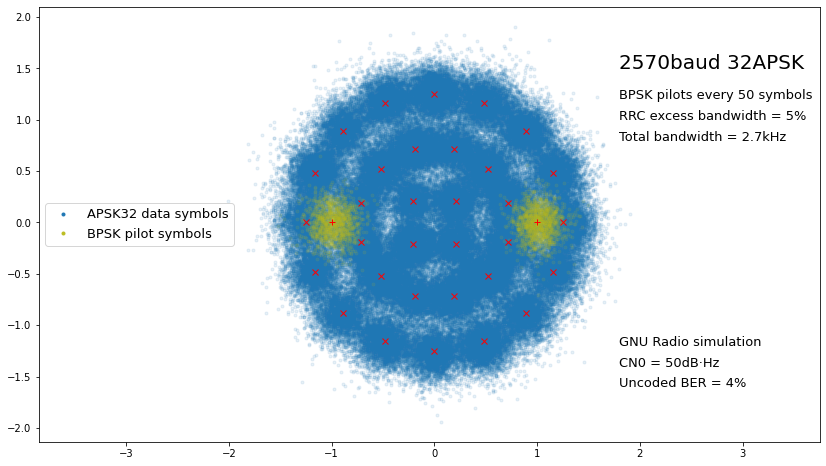
As an example of what a more complex, real-world signal looks like, the image below shows a GNU Radio simulation of the 32APSK constellation we studied in the last lesson. You can clearly see the three rings of points, but they are blurred into clouds by noise. You can also see additional BPSK pilot symbols (in yellow), which are used by the receiver to help correct for channel impairments.
Conclusion
In this lesson, you took your first practical steps with GNU Radio, bridging the gap between modulation theory and its implementation. You have learned how to construct a signal processing flowgraph from source, processing, and sink blocks to generate and visualize a digitally modulated signal.
Key takeaways include:
- A GNU Radio flowgraph processes data from a source, through processing blocks, to a sink.
- The
Constellation Modulatorblock, paired with aConstellation Object, maps input data to complex I/Q symbols. - The
QT GUI Constellation Sinkis an essential tool for visualizing the I/Q samples of a signal. - The
Channel Modelblock simulates real-world impairments like noise and frequency offset, which distort the ideal constellation points into rotating, noisy clouds.
You have now completed the foundational module of this course. You understand I/Q signals, are familiar with the key modulation schemes of DVB-S2, and have the basic skills to generate and visualize them in GNU Radio.
In the next module, we will begin our deep dive into the DVB-S2 standard itself. Our first lesson will describe the end-to-end DVB-S2 transmission chain, giving you a high-level map of the entire system before we start dissecting each component in detail.