Welcome to the final lesson in our module on connecting and monitoring your store with Google. In our last session, you completed a critical setup task by submitting your store's sitemap to Google Search Console. This act provided Google with a comprehensive map of your site, ensuring it can efficiently discover all your product and collection pages.
Now, we shift from telling Google about your site to listening to what Google tells you about its performance. It may take a few days or even weeks after submitting your sitemap for significant data to appear, but this lesson will equip you to understand it as it arrives. We will explore the Performance report in Google Search Console, focusing on the essential metrics of clicks, impressions, and average position. This is where you will see the tangible results of your SEO efforts.
Navigating to the Performance Report
First, let's locate the report. After logging into your Google Search Console account and selecting your Shopify store property, you will see a navigation menu on the left side of the screen. The data we are interested in is located in the "Performance" section.
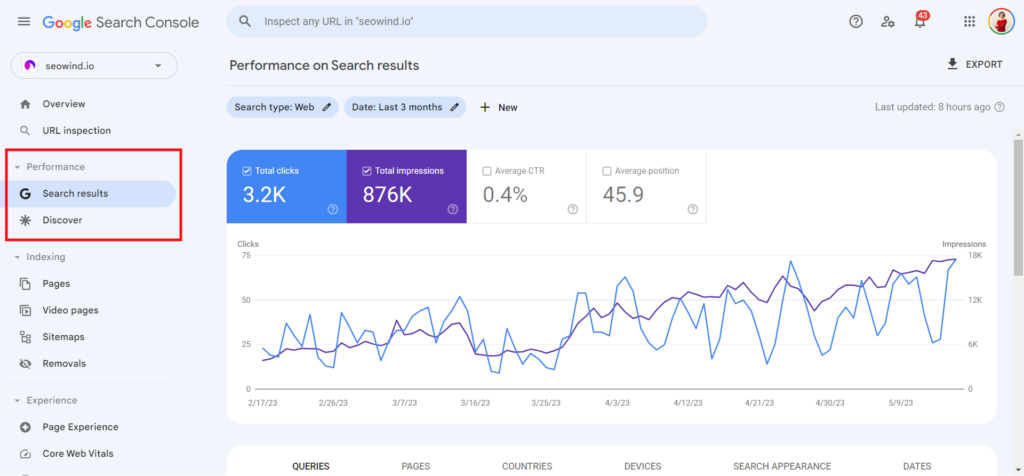
Clicking on "Search results" under "Performance" will take you to the main report where you'll spend most of your time monitoring your site's organic traffic from Google.
Understanding the Core Performance Metrics
The Performance report presents a wealth of data, but it all centers around four fundamental metrics. Understanding what each one represents is the key to interpreting your site's performance. The main chart at the top visualizes these metrics over time.
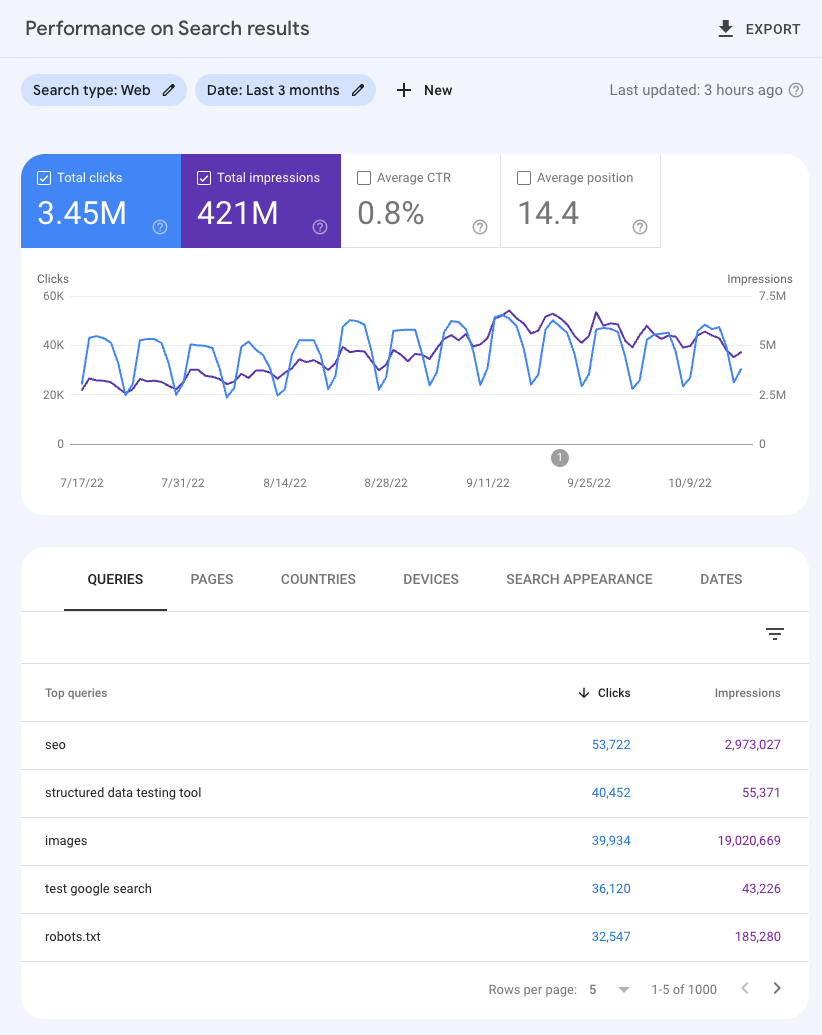
Let's define each of these metrics. The following video offers a clear and concise explanation of these core concepts.
Google Search Console Tutorial: Rank #1 on Google (Tips & Strategies)
This video from the Stewart Gauld channel provides an excellent introduction to the key metrics you'll find in the Performance report.
Watch the segment from this timestamp. Pay close attention to the definitions of Total Clicks, Total Impressions, Average CTR, and Average Position.
To summarize and reinforce these definitions:
- Impressions: An impression is counted every time a link to your site appears in a Google search result that a user views. The user doesn't have to click the link; they just need to have seen it on their results page.
- Clicks: A click is counted when a user clicks on your link from the Google search results page, leading them to your website. This is the ultimate goal—driving traffic.
- Average Click-Through Rate (CTR): This is the percentage of impressions that result in a click. It's calculated as . A low CTR can indicate that your page title and description aren't compelling enough to earn a click, even if you are ranking.
- Average Position: This is your site's average ranking in the search results for one or more queries. A position of 1-10 is generally on the first page. A lower number is better.
For a detailed written breakdown of these metrics, you can also refer to the following resource.
How to Add Google Search Console to Your Shopify Website - Tapita
This article from Tapita provides a clear, text-based explanation of the four core metrics and what they signify for your SEO strategy.
Please read the section under the heading "Understanding Search Performance Data". This will solidify your understanding of Clicks, Impressions, CTR, and Average Position.
Analyzing Your Performance Data
Below the main chart, you'll find a table with several tabs that allow you to analyze your performance from different angles: Queries, Pages, Countries, Devices, Search Appearance, and Dates.
- Queries: This tab shows you the actual search terms (keywords) people are using on Google to find your site. This is invaluable for understanding if you're attracting the right audience.
- Pages: This lists your top-performing pages, showing you which product, collection, or blog pages are getting the most impressions and clicks.
- Countries & Devices: These tabs show you where your traffic is coming from geographically and whether users are on desktop, mobile, or tablet.
The video below walks through these different tabs and how to interpret the information within them.
How to Use Google Search Console: Complete Step-By-Step Guide (Up-to-Date) + Free GSC Bundle
This guide from Portable Entrepreneur demonstrates how to use the different tabs in the Performance report to dig deeper into your data.
Watch the segment from this part of the video. The instructor explains how to switch between the Queries, Pages, Countries, and Devices views to analyze your traffic.
A Practical Strategy: Finding "Low-Hanging Fruit"
Now for the most important part: using this data to make improvements. One of the most effective strategies for a beginner is to find pages that Google already considers relevant but that aren't getting many clicks. These are your "low-hanging fruit."
You are looking for pages with high impressions but a low click-through rate (CTR).
This combination tells you that your page is appearing in search results frequently (so Google sees it as relevant), but your search result listing isn't compelling enough for users to click on it. As you learned in Module 3, the most likely culprits are an uninteresting page title or a weak meta description.
The following video shows you exactly how to identify these opportunities in your Performance report.
Google Search Console Tutorial: Rank #1 on Google (Tips & Strategies)
This segment demonstrates a powerful and practical technique: sorting your pages by impressions to find optimization opportunities.
Watch from this timestamp. Follow the steps to navigate to the "Pages" tab, sort by Impressions, and identify pages that have a high impression count but a low CTR and/or a poor average position. This is a core workflow for SEO improvement.
By following this process, you can identify a specific product or collection page and then return to your Shopify admin to optimize its title and meta description, just as you learned in the On-Page Optimization module. After making the changes, you can monitor this report over the next few weeks to see if the CTR improves.
Conclusion
This lesson marks a significant milestone in your SEO journey. You have not only set up the essential connection between your Shopify store and Google but also learned how to interpret the data Google provides back to you.
Here are the key takeaways from today's session:
- The Performance report in Google Search Console is your primary tool for monitoring organic search traffic.
- The four key metrics are Clicks, Impressions, Average CTR, and Average Position.
- You can analyze your performance by Queries (what people search for) and Pages (which of your URLs get traffic).
- A powerful, actionable strategy is to find pages with high impressions and low CTR, as improving their title and meta description can provide a quick traffic boost.
You now have the complete foundational toolkit for an e-commerce SEO strategy: you know how to research keywords, optimize your pages in Shopify, and now, how to measure the impact of your work using Google Search Console. Congratulations on completing this foundational module