Hello! Welcome back.
In our last lesson, we rounded out your tour of the "happy path" in REPL-driven development. You learned how to manage namespaces, reload code robustly with cider-ns-refresh, inspect complex data structures, and access documentation without leaving Emacs. These skills form the backbone of a fluid and efficient Clojure workflow.
However, development isn't always a straight line. Today, we'll address the "unhappy path": what happens when your code breaks. The goal of this lesson is to learn how to interpret error messages and stack traces within the CIDER environment. This is the final, crucial piece of the core CIDER skillset, turning moments of failure from frustrating roadblocks into valuable sources of information.
We will cover two main topics:
- Reactive Debugging: Understanding the exceptions and stack traces that Clojure and CIDER provide when an error occurs.
- Proactive Debugging: Using the powerful CIDER interactive debugger to step through your code and inspect its state.
By the end of this lesson, you'll be able to confidently diagnose and fix errors, completing your foundation in interactive Clojure development.
1. Understanding Exceptions and Stack Traces
When you evaluate code that contains an error, Clojure throws an exception. Since Clojure runs on the Java Virtual Machine (JVM), these exceptions and their corresponding stack traces will contain information from the Java runtime, which can sometimes be verbose. CIDER provides excellent tools to help you cut through the noise.
Let's start by intentionally causing an error. One of the most common errors for newcomers is the ArityException, which occurs when you call a function with the wrong number of arguments.
How to Use Emacs, an Excellent Clojure Editor
The book 'Clojure for the Brave and True' has a great section on how Emacs and CIDER present errors. This will walk you through your first encounter with a Clojure stack trace.
Please read the section titled 'How to Handle Errors'. As you read, try the example in your own REPL: evaluate (map) and observe the result. Don't worry about the 'Paredit' section that follows.
As the reading explains, when an error occurs, you get feedback in two places:
- The REPL buffer: A concise error message is printed.
- The
*cider-error*buffer: A detailed stack trace appears, usually in a split window.
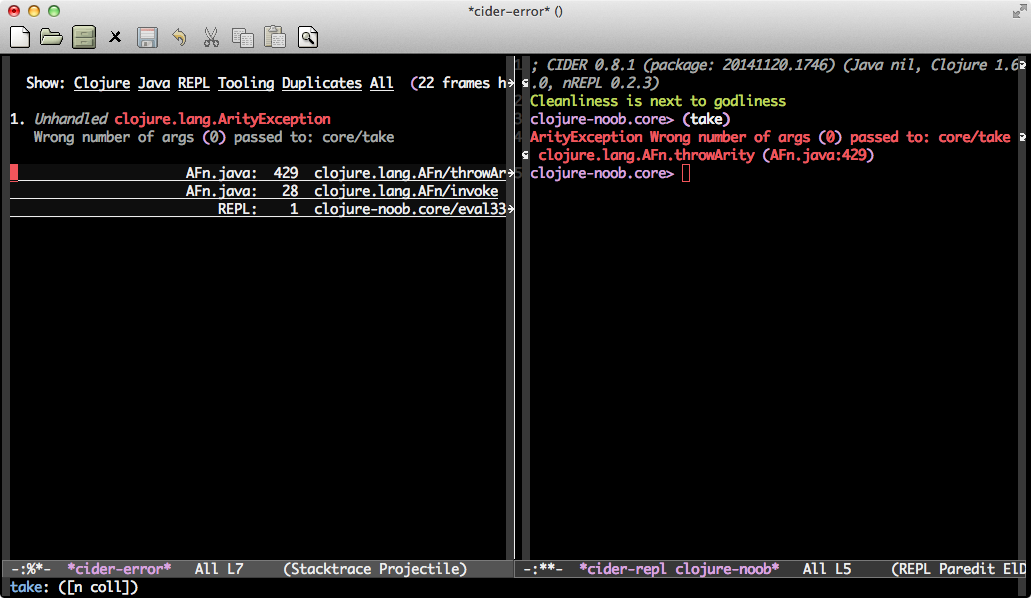
A stack trace is a report of the active stack frames at a certain point in time when an error was thrown. You've likely encountered these in Python or other languages. In Clojure, the trace shows the sequence of function calls that led to the error, starting from the most recent. Because of the JVM interop, these traces can be long, but the most important information is usually near the top.
The key is to find the part of the trace that corresponds to your code. CIDER helps by highlighting lines and allowing you to filter out noise from the Clojure runtime, Java, and the REPL itself. Clicking a line in the stack trace will jump you directly to the source code, which is an incredibly useful feature.
Exercise 1: Generating Common Errors
To get a feel for this, let's generate a few different types of exceptions. Open your src/fx_calculator/core.clj file, make sure your CIDER REPL is running, and evaluate the following expressions one by one using C-x C-e. Observe the output in both the REPL and the *cider-error* buffer.
ArityException(Wrong number of arguments):(inc 1 2)ClassCastException(Wrong data type):(inc "hello")CompilerException/RuntimeException(Error during execution):(/ 1 0)CompilerException(Unresolved symbol):(this-function-does-not-exist 42)
After evaluating each, close the *cider-error* buffer by switching to it (C-x o) and pressing q. Notice how the error messages clearly describe the problem.
2. Proactive Debugging with the CIDER Debugger
Reading a stack trace is a reactive way to find out what went wrong. A more proactive approach is to use an interactive debugger to pause execution and inspect the state of your program. This is invaluable for understanding complex logic or hunting down subtle bugs.
CIDER includes a powerful debugger. You "instrument" a function for debugging, which injects breakpoints into its code. When you then call that function, execution pauses at each breakpoint, allowing you to inspect local bindings and step through the code.
The official CIDER documentation explains how to start the debugger and what breakpoints are.
Read the sections 'Using the Debugger' and 'Understanding Breakpoints'. Focus on the two primary ways to start a debugging session: the C-u C-M-x keybinding and the #dbg reader macro.
The two main ways to instrument a function are:
C-u C-M-x: With your cursor inside a top-level form (like adefn), this command evaluates and instruments it. This is a temporary instrumentation that is removed the next time you evaluate the form normally (e.g., withC-M-x).#dbg: Placing this reader macro before a form tells CIDER to break at that specific point. This is more explicit and useful for debugging a specific expression within a larger function.
Exercise 2: Your First Debugging Session
Let's debug a simple function. Add the following function to your fx_calculator/core.clj file.
(defn process-numbers
  "Filters numbers greater than a threshold, doubles them, and returns the sum."
  [numbers threshold]
  (let [filtered (filter #(> % threshold) numbers)
        doubled (map #(* 2 %) filtered)]
    (reduce + 0 doubled)))
Now, let's step through it:
- Instrument the function: Place your cursor anywhere inside the
(defn process-numbers ...)form and pressC-u C-M-x. The minibuffer will confirm that the function was instrumented. - Call the function: Go to your REPL and call the function:
(process-numbers [1 5 10 2 8] 3) - Enter the debugger: Execution will pause. Your Emacs will look different: the code buffer will be highlighted, and the minibuffer will display the first value being evaluated along with a
[d]bg>prompt. You are now in a debugging session.
3. Navigating the Debugger
Once you're in a debugging session, you can use single-key commands to control the flow of execution.
This part of the CIDER documentation lists the available debugger commands and explains the most important ones for stepping through code.
Skim the table in the 'Keys' section to see what's available. Then, read 'Stepping Command Details' and 'Other Command Details' to understand the core commands.
The number of commands can seem overwhelming, but you will use a small subset most of the time. Here are the essentials:
| Key | Command | Description |
|---|---|---|
n |
next |
Step to the next breakpoint. This is your primary way of moving forward. |
i |
in |
Step into a function call to debug it. |
o |
out |
Step out of the current expression. |
c |
continue |
Resume normal execution, stopping only at the next manual #break. |
p |
inspect |
Inspect the value of the current expression in the CIDER inspector. |
e |
eval |
Evaluate an expression in the current lexical context (you can access locals!). |
q |
quit |
Abort execution of the function entirely. |
Exercise 2 (Continued): Stepping Through Code
Let's use these commands to explore the process-numbers execution you started.
- The debugger is paused at the
letform. The value being shown is the result of the(filter ...)expression. Pressp. An inspector buffer will open showing the resulting lazy sequence(5 10 8). Pressqto close the inspector. - Press
n(next). Execution moves to the next form inside thelet,(map #(* 2 %) filtered). The minibuffer shows you the result of this map operation, another lazy sequence. - Press
nagain. Execution moves to thereduceform. The minibuffer shows the final result:46. - Press
c(continue). Execution finishes, and46is printed in your REPL. The debugging session for this function call is over.
Finally, to remove the instrumentation, simply re-evaluate the function normally. Place your cursor in the defn and press C-M-x.
As a final point, the CIDER docs mention conditional breakpoints (:break/when). You don't need to memorize the syntax now, but it's worth knowing that this capability exists. In your work with stochastic systems and statistical models, you might need to debug a function that is called thousands of times in a loop, but only fails under a specific condition. A conditional breakpoint is the perfect tool for that scenario.
Conclusion
You have now completed the foundational module on using Clojure with Emacs and CIDER. You've gone from a clean slate to a fully-featured, interactive development environment. You can create projects, write code, manage application state, inspect data, read documentation, and now, debug errors.
Key Takeaways:
- Errors in Clojure produce exceptions and stack traces. CIDER presents these in the REPL and a dedicated
*cider-error*buffer. - Focus on the parts of the stack trace that reference your own namespaces to quickly locate the source of an error.
- The CIDER debugger allows you to pause execution and step through your code interactively.
- Instrument a function for debugging with
C-u C-M-xfor the whole function or#dbgfor a specific form. - Use
n(next),p(inspect),c(continue), andq(quit) to navigate a debugging session.
With this tooling knowledge in place, you are now fully equipped to explore the Clojure language itself. In our next lesson, we will begin Module 2, diving into the core principles that make Clojure unique: its philosophy, its powerful and immutable data structures, and its functional nature.