Welcome to the second lesson in our module on observability. In our previous discussion, we established the foundation of Azure Monitor, dissecting its dual data platform of metrics and logs and the architecture for collecting this telemetry from your infrastructure. Now, we move up the stack from the platform to the application itself.
Today's lesson focuses on one of the most critical components in a modern monitoring strategy: Application Insights. Our learning outcome is to explain the role of Application Insights in application performance monitoring (APM) and distributed tracing. For an architect designing and operating complex, distributed systems, simply knowing if a server is online is insufficient. You need to understand the health, performance, and dependencies of the application code itself. Application Insights provides this deeper level of visibility. We will explore what APM entails, how distributed tracing works to illuminate the request flows in a microservices world, and the pivotal architectural shift towards the open standard of OpenTelemetry.
What is Application Performance Monitoring (APM)?
Before diving into Application Insights, let's clarify what we mean by Application Performance Monitoring (APM). Historically, monitoring focused on infrastructure resources: CPU, memory, disk, and network. APM shifts the focus to the application's perspective, answering questions like:
- Which user requests are the slowest, and why?
- Which external dependency (database, API) is causing a bottleneck?
- When an error occurs, what was the sequence of events and the state of the application that led to it?
This evolution is especially critical in cloud-native architectures. The following short video provides a good conceptual framing for how traditional APM struggles with modern microservices and how the idea of observability emerged to solve this.
Observability vs. APM vs. Monitoring
This clip from IBM Technology gives a concise overview of how APM concepts evolved to address the complexity of microservices.
Watch these two brief segments: Traditional APM: A quick definition of APM in the context of monolithic applications. The microservices challenge: Explains why traditional approaches fall short in a distributed environment, creating the need for comprehensive tracing.
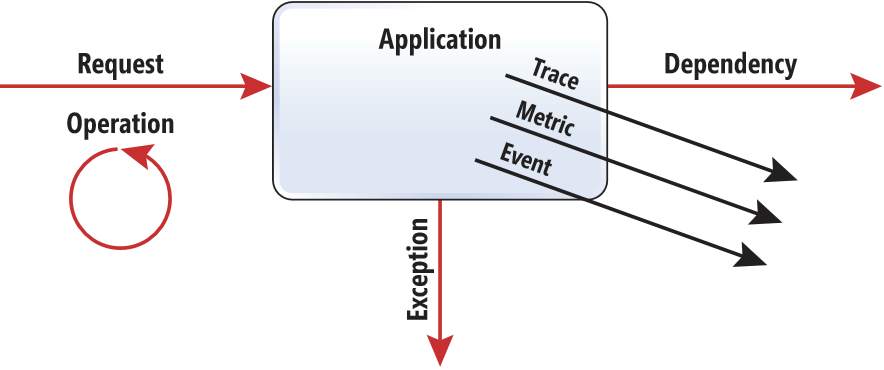
Application Insights is Azure's native APM service, designed to provide these deep insights. It integrates with your application via an SDK or auto-instrumentation to collect detailed telemetry, which is then sent to the Azure Monitor data platform we discussed in the last lesson.
The Core of APM: Distributed Tracing
In a microservices architecture, a single user action might trigger a chain of calls across a dozen services. If that action is slow or fails, how do you pinpoint the source of the problem? This is the challenge that distributed tracing solves.
A distributed trace pieces together the journey of a single request as it propagates through the various services. Each step in the journey is called a span. The entire end-to-end flow is the trace. To make this possible, services must propagate a correlation context—typically a set of unique IDs in the HTTP headers—with every outbound call.
Technically, how is this correlation achieved in a .NET application? The key is the System.Diagnostics.Activity class, which has been part of .NET for some time but became central with the rise of distributed tracing.
Logging, tracing and metrics: instrumentation in .NET and Azure - Alex Thissen - NDC London 2023
In this excerpt from an NDC London talk, Alex Thissen provides an excellent technical explanation of the Activity class and how it facilitates distributed tracing. This context is valuable for understanding what happens under the hood.
Please watch the segment from activities and correlation. Focus on how an Activity carries contextual information, travels across threads and processes, and enables correlation between services.
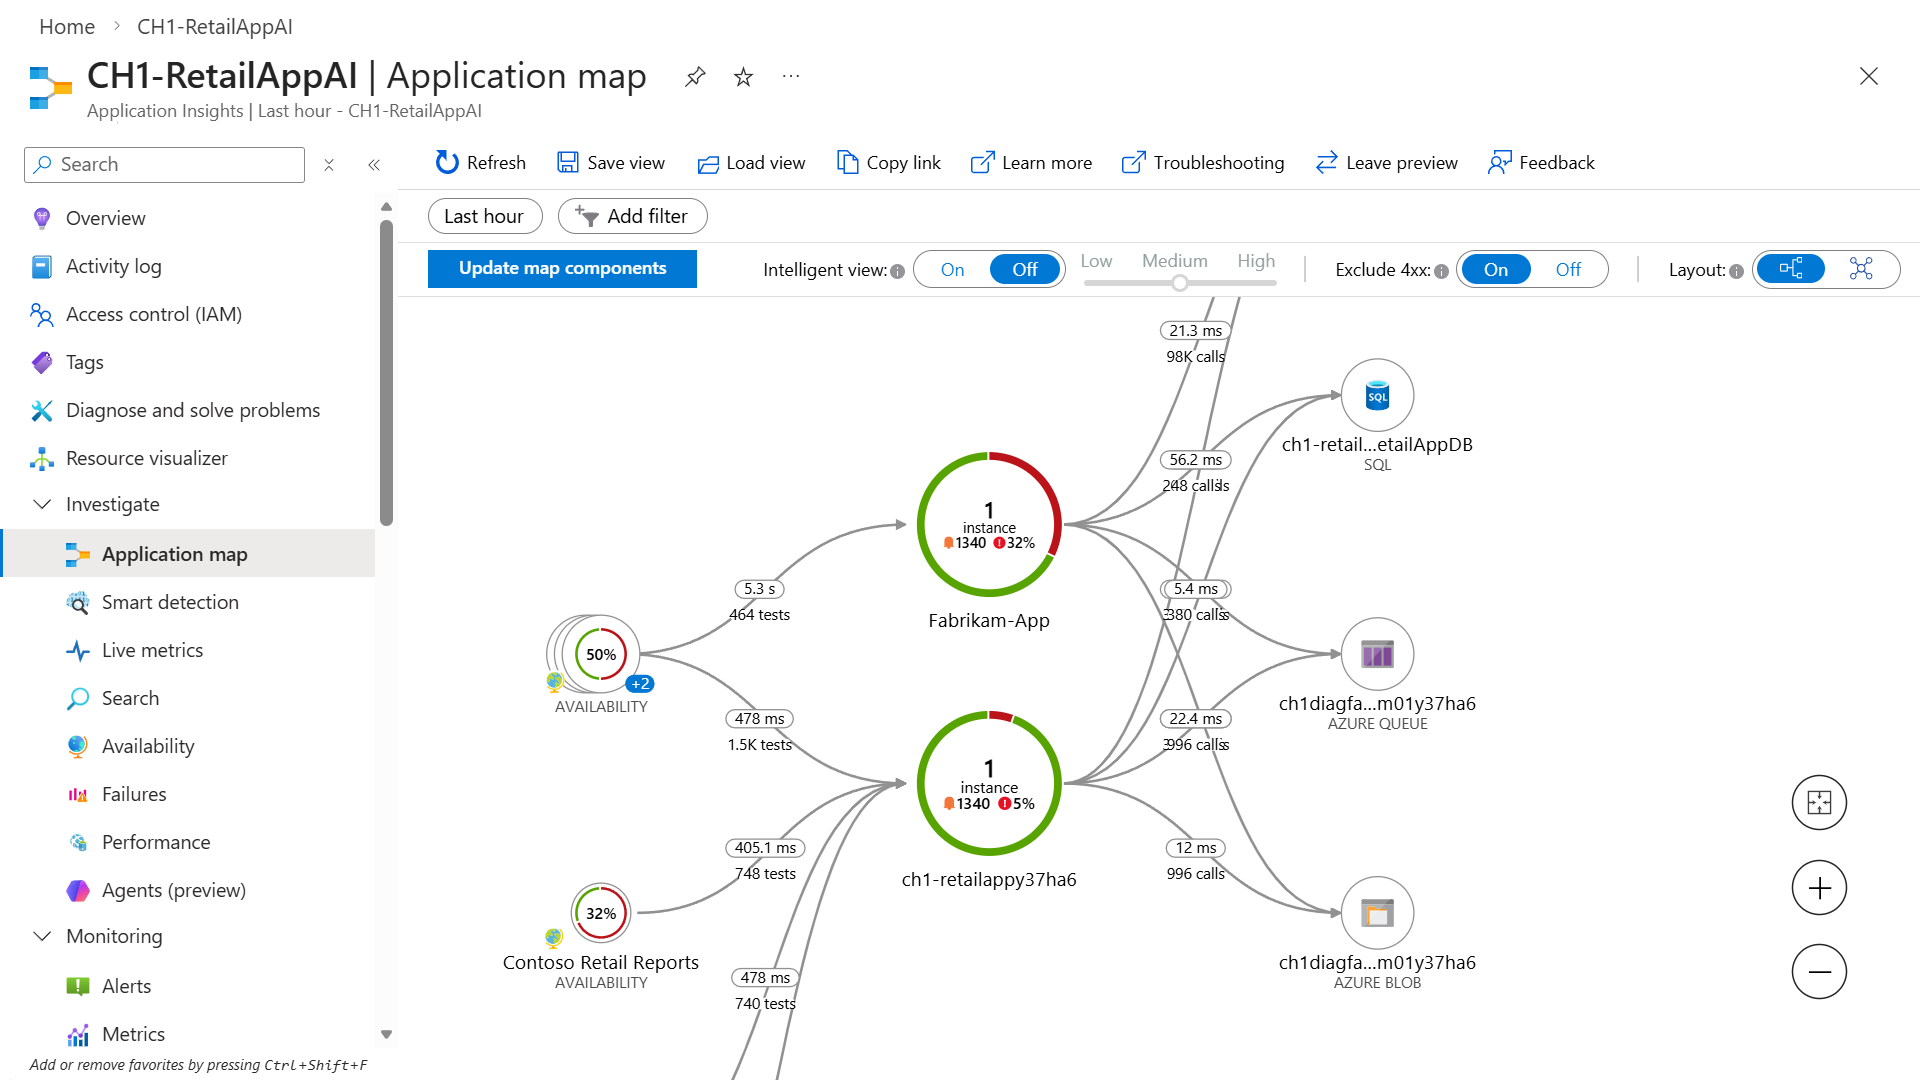
As the video explains, an Activity represents a unit of work and carries context (like TraceId and SpanId). When an instrumented application makes an HTTP call, it injects this context into the headers. The receiving service extracts the context and creates a new, child Activity, preserving the link to the original caller. Application Insights uses this parent-child relationship between activities to stitch together the end-to-end trace you see in the Application Map.
The Architectural Shift to OpenTelemetry
Initially, APM vendors, including Microsoft, used their own proprietary headers for trace context propagation. This worked, but it created vendor lock-in and made it difficult to trace requests across a polyglot system where services might use different APM tools.
To solve this, the industry has rallied around two key standards:
- W3C Trace Context: A standard for propagating trace context in HTTP headers (
traceparent,tracestate). - OpenTelemetry (OTel): A CNCF-backed open-source project that provides a unified set of APIs, SDKs, and tools for instrumenting applications to collect traces, metrics, and logs. It is vendor-agnostic.
Microsoft has fully embraced this shift. Application Insights is now effectively an OTel-compatible backend. This means you can use standard OpenTelemetry instrumentation in your applications, and configure it to export telemetry to Azure Monitor.
The following article provides a superb architectural overview of this transition and its implications.
Leveraging Azure Application Insights with OpenTelemetry
This article from cicoria.com is an excellent deep-dive into the "why" and "how" of Application Insights' adoption of OpenTelemetry. It's written from an architect's perspective and covers the key concepts perfectly.
Please read the following sections: Overview of Distributed Tracing: This provides context on the original proprietary correlation protocol used by Application Insights. Transition to Open Telemetry: This is the most crucial part. It explains the benefits of adopting OTel, such as vendor neutrality, standardization, and performance. Pay close attention to the idea that Application Insights becomes a "backend for standard OTel data."
For a Principal Engineer, understanding this strategic shift is paramount. Recommending an instrumentation strategy based on OpenTelemetry aligns your architecture with industry standards, prevents vendor lock-in, and gives you access to a vast ecosystem of instrumentation libraries for virtually any language or framework.
Microsoft provides the Azure Monitor OpenTelemetry Distro, which is a supported package that bundles the standard OTel SDKs and pre-configures them to work seamlessly with Application Insights. For .NET developers, this means moving from the old Microsoft.ApplicationInsights.AspNetCore NuGet package to the new Azure.Monitor.OpenTelemetry.AspNetCore package. This isn't just a version update; it's a fundamental change in the instrumentation pipeline.
The article you just reviewed has further sections detailing this migration. While we won't go into a line-by-line code review, understanding the conceptual differences is important.
Leveraging Azure Application Insights with OpenTelemetry
Continuing with the same article, let's look at what this migration means in practice for developers.
Please read these two sections: Migration from Application Insights SDK: Skim this section to understand the benefits of the new OTel-based distro, such as unified telemetry and ease of setup. Note the shift towards using framework-neutral APIs. Separation of Logging and Tracing: This section clarifies a key point for developers—you continue to use the standard ILogger interface for logging, and the OTel pipeline automatically correlates those logs with the active trace.
The key takeaway is that by adopting the OTel-based approach, application code becomes decoupled from the specific APM backend. You instrument your code using standard APIs (ILogger, ActivitySource), and the OTel exporter handles sending that data to Application Insights.
Architectural Design: Structuring Your Application Insights Resources
When adopting Application Insights for a large system, a primary architectural decision is how to structure your resources. Do you use a single Application Insights resource for all your microservices, or a separate resource for each one?
Each approach has significant trade-offs related to governance, cost, and operational simplicity.
Leveraging Azure Application Insights with OpenTelemetry
This final reading from the same article provides a fantastic "compare and contrast" analysis of the different architectural patterns for deploying Application Insights.
Please read the entire section Application Architecture Using Application Insights. Pay close attention to: The pros and cons of Separate vs. Shared instances. The role of the cloud_RoleName property in distinguishing services within a shared instance. The central role of the Log Analytics workspace as the unified query layer, which connects back to our previous lesson.
To summarize the trade-offs:
| Approach | Pros | Cons |
|---|---|---|
| Shared Instance (One AI resource for multiple services) | - Unified View: All telemetry in one place; easy cross-service querying. - Simplicity: Application Map works out-of-the-box. - Cost: Easier to hit commitment tiers for data ingestion. |
- Lack of Isolation: All teams see all data. - Noisy Neighbor: A single chatty service can dominate ingestion limits and costs. - Uniform Configuration: Data retention and sampling settings apply to all services. |
| Separate Instances (One AI resource per service) | - Isolation & Ownership: Clear boundaries for access control and billing. - Granular Configuration: Each service can have its own retention and sampling settings. |
- Query Complexity: Requires cross-resource queries in Log Analytics to correlate data. - Configuration Overhead: Application Map may require manual linking. - Cost: Harder to consolidate data volume to reach commitment tiers. |
A common hybrid approach is to use separate Application Insights resources but have them all send data to a single, shared Log Analytics workspace. This provides a good balance: logical separation at the Application Insights level, but a unified data plane for querying.
The Azure Well-Architected Framework provides official guidance that reinforces these patterns.
Architecture Best Practices for Azure Monitor Application Insights
This document from the Well-Architected Framework outlines Microsoft's official best practices for deploying Application Insights.
Please review the Configuration recommendations tables in the following sections: Reliability: Note the recommendation for one resource per workload per environment. Operational Excellence: This strongly recommends adopting the OpenTelemetry Distro. Performance Efficiency: Reinforces the per-workload model and touches on performance considerations.
The consensus best practice is to start with one Application Insights resource per application/workload, per environment (e.g., My-App-Dev, My-App-Prod). This aligns with the "separate instances" model, providing the best isolation and governance, while relying on the power of cross-workspace queries in Log Analytics for a holistic view when needed.
Conclusion
In this lesson, we've explored the crucial role of Application Insights as Azure's service for Application Performance Monitoring. We've seen that it moves beyond simple infrastructure metrics to provide deep visibility into application behavior, performance bottlenecks, and failures.
Key Takeaways:
- APM provides application-centric monitoring, helping you diagnose performance issues and errors from the user's perspective.
- Distributed tracing is the cornerstone of modern APM, allowing you to follow a single request's journey across complex microservice architectures. The
Activityclass in .NET is the mechanism that enables this. - The industry is standardizing on OpenTelemetry (OTel) for instrumentation. Application Insights is now an OTel-compatible backend, and using the Azure Monitor OTel Distro is the recommended approach for new applications.
- A key architectural decision is whether to use shared or separate Application Insights instances. The best practice is typically to use separate instances per workload and environment for better isolation, while leveraging a shared Log Analytics workspace for unified analysis.
You now understand how to instrument your applications to get rich telemetry. But once you have this data, how do you analyze it to find the needle in the haystack? Our next lesson will equip you with the skills to do just that, as we learn to formulate basic queries using Kusto Query Language (KQL) to analyze the vast amounts of operational data stored in Log Analytics.