Hello! Welcome back to our module on IELTS Writing Task 1.
In our last lesson, you learned the essential four-paragraph structure for any Task 1 report: Introduction, Overview, and two Body Paragraphs. This structure is your blueprint for a clear and well-organized response.
Today, we will build directly on that foundation. Knowing the structure is the first step; knowing what information to put into it is the second. This lesson focuses on the crucial analysis you must do before you write. The learning outcome is to identify key features and trends in graphs, charts, and tables. By the end of our session, you'll have a systematic method for looking at any data visual and quickly finding the most important points to include in your report. This skill is critical for achieving a high score in the 'Task Achievement' criterion.
1. The Strategy: From Data to Key Features
The IELTS instructions always ask you to "summarise the information by selecting and reporting the main features." This means you should not describe every single number. Your first job is to be a detective, looking for the most important clues in the data.
What are these "main features"? They can be:
- Overall trends: The general direction of change over time (e.g., a steady increase, a sharp fall).
- Key numbers: The highest and lowest points (peaks and troughs), and the starting and ending values.
- Comparisons: The biggest and smallest items, or how different categories relate to each other.
- Exceptions: Any data that does not follow the main trend.
A great way to approach this is with a clear, step-by-step process. Let's start by reading about a professional method for analyzing Task 1 data.
Data essays: Our 3-step process
The provided guide, 'GET IELTS BAND 9', outlines a 3-step process used by high-scoring candidates. We will focus on the first two steps, which are all about analysis.
Please read the sections 'Step 1 Analyse the Task and data' and 'Step 2 (b) Identify trends and exceptions'. You will find these on pages 3-6. Focus on understanding the difference between 'static' and 'movement' data, and how to spot trends and exceptions.
The reading introduces some essential ideas. Let's formalize them into a checklist you can use every time you see a chart or graph.
2. Your Analysis Checklist
Before you write a single word of your report, take a few minutes to analyze the visual data. Here's a checklist to guide you, combining ideas from the guide you just read and other expert sources.
For any chart, graph, or table, ask yourself:
-
What does everything represent?
- Read the title and the brief description.
- Check the axes (the horizontal 'x' and vertical 'y' axis on a graph). What do they measure?
- What are the units? (e.g., tonnes, %, thousands of dollars, megawatts).
-
What are the main trends?
- Look at the data from beginning to end. What is the overall movement? Does it mainly go up, down, or does it fluctuate?
- Are there any obvious high points (peaks) or low points?
-
What are the key comparisons or groups?
- Which items are the biggest or smallest?
- Can you see any items that behave in a similar way? (e.g., two countries where sales increased). These can be grouped together in a paragraph.
-
Are there any exceptions?
- Does one item behave differently from the rest? (e.g., while all other countries' sales went up, one country's sales went down). This is an excellent feature to highlight.
This checklist is explained very clearly on the website IELTS Jacky.
IELTS Academic Writing Task – How To Understand Task 1
This webpage provides simple checklists for analyzing different chart types. It's a very practical tool to help you quickly identify the main features.
Read the sections titled 'Bar Charts & Line Graphs', 'Tables', and 'Pie Charts'. Notice how the same core questions about trends, comparisons, and key information apply to each type of visual.
3. Identifying Trends in a Line Graph
Line graphs are very common in Task 1, and they are perfect for showing trends over time. Let's watch a video that demonstrates how to analyze one and introduces the essential vocabulary you'll need.
IELTS Academic Writing Task 1 | Describing Trends | IELTS Vocabulary & Word Order | Business English
This video from Woodward English focuses on describing trends. It will show you how to identify the general direction of a line graph and, crucially, teach you the language to describe it.
Please watch these three segments: (01:39 - 04:21): Focus on how to identify the 'general trend' instead of just listing numbers. (14:52 - 18:35): Pay close attention to the lists of verbs (e.g., 'rise', 'fall') and adverbs (e.g., 'sharply', 'steadily') used to describe different types of change. (24:23 - 25:51): Learn the specific vocabulary for features like 'fluctuation', 'peak', and 'plateau'.
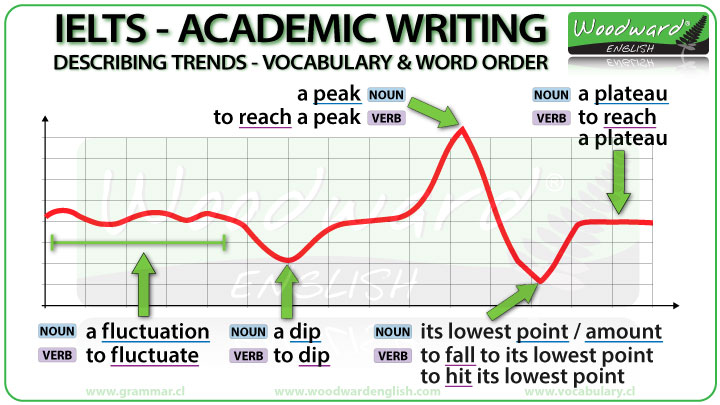
The video introduces some very important vocabulary. This image provides a helpful visual summary of the key terms for describing specific points on a line graph.
4. Practice: Analyzing a Combined Chart
Now, it's your turn to be the detective. Look at the following IELTS task, which includes a pie chart and a table. Using the checklist from section 2, try to identify 3-4 main features. Don't write a full report yet—just make notes.

Take about 5 minutes to analyze the image and answer these questions in your notes:
- Pie Chart: What is the largest segment? What are the two smallest segments?
- Table: Which employment sector has the highest average income? Which has the lowest?
- Comparison: Is there any surprising connection or contrast between the two charts? (There isn't always an obvious one, but it's good to look!)
Your Analysis (Example Answers):
- Main feature 1 (Pie Chart): The vast majority of graduates went into full-time work immediately.
- Main feature 2 (Table): The finance sector offers the highest average income by a large margin.
- Main feature 3 (Table): While a high percentage work in government (22%), the salary is not the highest.
- Main feature 4 (Pie Chart): Very few graduates were unemployed.
This is exactly the kind of thinking you need to do. By identifying these points first, you already have the main ideas for your Overview and Body Paragraphs.
5. Watch an Expert Analysis
To finish, let's watch a short video where an expert analyzes a line graph and decides what to include in the overview. This will bring together everything we've learned today.
(2025) Essential Guide to IELTS Academic Writing Task 1
In this clip from 'Essential Guide to IELTS Academic Writing Task 1', the presenter breaks down a line graph about the popularity of different sports.
Watch from 07:20 to 09:34. As you watch, notice how the presenter doesn't just look at one line. He groups the information into: Trends that increase. Trends that decrease. A special feature (one sport is always the most popular). This is a perfect example of selecting the main features for an overview.
The process you saw in the video—identifying increasing trends, decreasing trends, and other standout features—is the core skill for today's lesson.
Conclusion
Well done! You've moved beyond just knowing the structure of a Task 1 report and have now learned how to analyze the data to find the content for it.
Key Takeaways:
- Always spend a few minutes analyzing the visual data before you start writing.
- Use a systematic checklist: understand the basics (title, axes, units), then look for trends, comparisons, and exceptions.
- The main features are often the highest and lowest points, overall increases or decreases, and items that behave differently from the group.
- Identifying these key features provides the main points for your Overview and the focus for your Body Paragraphs.
In our next lesson, we will focus on the most important paragraph in your report: the overview. Now that you can successfully identify the main features, we will practice how to write an overview that summarizes the most significant information clearly and concisely.