Hello! Welcome to your next lesson in the Advanced Analytics & Performance Reporting module.
In our last session, you mastered using regular expressions in Google Search Console to isolate very specific traffic segments. This gave you a powerful way to understand how different user groups arrive at your site from search.
Today, we take the next logical step. Your learning outcome is to create custom exploration reports in Google Analytics 4 to analyze SEO-driven user journeys. We'll go beyond the initial click and landing page to uncover what your organic visitors actually do once they are on your site. This is how you connect SEO efforts to tangible business outcomes like engagement, leads, and sales.
1. Beyond the Click: The Full SEO User Journey
As an experienced SEO, you know that reporting often stops at clicks and impressions. However, the real value of SEO is demonstrated in the steps that follow:
Impression → Click → Landing → Engagement → Micro-Conversion → Conversion.
Understanding this full journey allows you to move the conversation from "traffic is up" to "we improved the organic user journey and unlocked X more conversions." GA4's Explore section is our primary tool for this analysis.
We'll focus on two powerful report types within the Explore hub:
- Path Exploration: To visualize the free-flowing paths users take from page to page.
- Funnel Exploration: To measure how users progress through a specific, pre-defined conversion path.
2. Isolating Your Target: Analyzing Organic Traffic
Before we can analyze the journey, we need to ensure we're looking only at users who arrived from organic search. While we can build a formal segment, a quick and effective way to start is by filtering standard reports.
The following video from Orbit Media Studios provides a great practical overview of how to apply filters and customize reports to focus on organic traffic and its conversion performance.
GA4 for SEO: 5 Reports for Organic Traffic and Lead Generation
Watch this video to see how to filter GA4 reports for organic traffic and customize them to show the metrics that matter, like conversion rates.
Please watch from 01:53 to 06:40. Pay close attention to these three key actions: Filtering the Landing Page report to show only the 'organic' session medium. Customizing a report to add the 'Conversion rate' metric. Applying a second filter to exclude low-intent traffic (like blog readers) to get a clearer conversion signal for commercial pages. This connects directly to the URL segmentation you learned with RegEx.
This filtering technique is the foundation for all the SEO-driven journey analysis we will perform in GA4.
3. Discovering User Pathways with Path Exploration
Path Exploration lets you see the unstructured, real-world routes users take through your site. It’s perfect for answering questions like:
- "After landing on our most popular blog post, where do users go next?"
- "What are the most common pages users visit right before making a purchase?"
- "Are users getting stuck in a loop or hitting a dead end?"
Building a Forward Path Analysis
Let's trace the journey from an organic landing page.

To build a meaningful SEO path analysis, you will typically:
- Navigate to Explore > Path Exploration.
- Create a segment for Organic Traffic: In the "Variables" column, click the '+' on Segments, choose "Session segment", and set the condition to
Session mediumexactly matchesorganic. Give it a name like "Organic Sessions" and save it. Drag this new segment into the "Segment" box in the "Tab Settings" column. Now, your entire exploration will only show data from organic users. - Start with a Landing Page: Click "Start Over" in the top right. For the "Starting point," choose
Page path and screen class. Then, select a specific high-traffic organic landing page you want to analyze. - Trace the Path: The report will now show your chosen landing page as Step 1. You can click on that node to see the top pages users visited next. You can continue clicking through up to 10 steps to visualize the complete journey.
The Power of Reverse Path Analysis
One of the most valuable features is the ability to work backward from a conversion.
Path exploration in Google Analytics 4 (2026) || Path reports in GA4
The 'Path exploration in Google Analytics 4' video from Analytics Mania offers a fantastic walkthrough of both forward and reverse pathing.
Watch from 03:46 to 08:20. Focus on two concepts: Starting from an ending point: See how to select a conversion event like 'purchase' and work backward to find the pages that led to it. Changing the metric: Notice the switch from 'Event count' to 'Total users'. This is important because one user can trigger many events, so 'Total users' often gives a more accurate view of the journey.
By starting with a key conversion event (like generate_lead or purchase) and applying your "Organic Sessions" segment, you can build a map of the most profitable user journeys originating from SEO. This is invaluable for identifying which content and internal links are most effective at driving revenue.
Test your understanding!
You notice that many organic users who convert to a paid subscription first visit the /case-studies page. However, very few of your blog posts link to this page. What kind of Exploration report would help you confirm this, and what action might you take?
Show answer
You would use a Reverse Path Exploration.
- Start with the
subscription_purchaseevent as your endpoint. - Apply the "Organic Sessions" segment.
- Work backward to see the common page paths leading to the conversion.
If you confirm that /case-studies is a frequent final step before conversion, you would prioritize adding more prominent internal links from relevant, high-traffic blog posts to your /case-studies page to guide more organic users down this proven conversion path.
4. Measuring Key Journeys with Funnel Exploration
While Path Exploration is for discovery, Funnel Exploration is for measurement. You use it to track how well users complete a specific, pre-defined journey you want them to take. It's the perfect tool for analyzing checkout processes, lead generation forms, or sign-up flows.
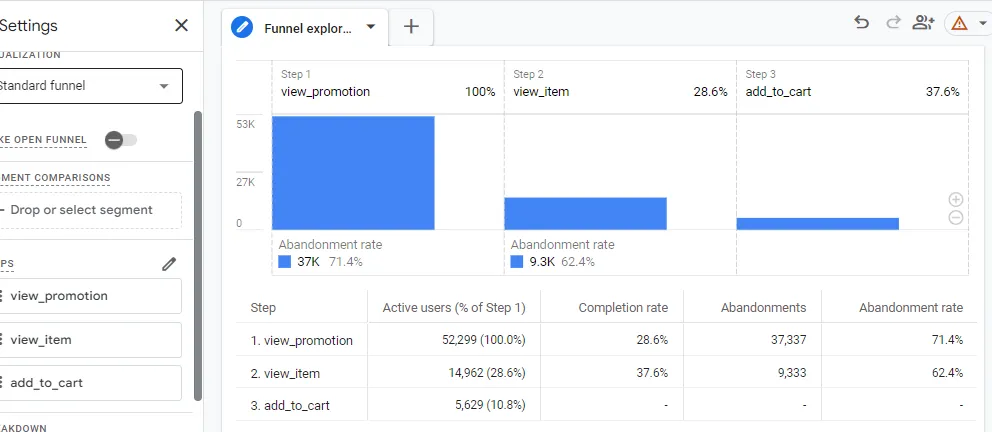
Let's walk through how to build a funnel to analyze an SEO-driven user journey.
How To Track User Journey In GA4 To Make SEO Wins ...
This article from Search Engine Journal, 'How To Track User Journey In GA4', provides a clear, step-by-step guide to setting up a Funnel Exploration.
Please read the sections 'How To Set Up User Journey Tracking In GA4 In 4 Steps', 'Use Breakdowns To Uncover Detailed Insights', and 'Save The Exploration As A Custom Report'. Focus on the logic of defining steps and applying breakdowns to get more granular insights.
As the article explains, the process involves:
- Navigate to Explore > Funnel Exploration.
- Apply your "Organic Sessions" segment. This ensures the funnel only reflects the behavior of users from organic search.
- Define the Steps: In the "Tab Settings" column, define each stage of your desired journey. For example, for an e-commerce site, this might be:
- Step 1: Users view a product category page (e.g.,
Page pathcontains/mens-shoes/). - Step 2: Users view a product detail page (e.g.,
Event nameisview_item). - Step 3: Users add an item to the cart (e.g.,
Event nameisadd_to_cart). - Step 4: Users complete the purchase (e.g.,
Event nameispurchase).
- Step 1: Users view a product category page (e.g.,
- Analyze the Drop-offs: The report will show you the percentage of users who proceed from one step to the next and, more importantly, the percentage who drop off. A large drop-off between two steps indicates a point of friction that you can investigate and optimize with better content, UX, or internal linking.
- Use Breakdowns: Add a breakdown dimension like
Device categoryorCountryto see if drop-off rates are higher for specific user segments (e.g., "Are mobile users abandoning the cart at a higher rate than desktop users?").
By analyzing your key conversion funnels specifically for organic traffic, you can pinpoint exactly where you're losing potential customers and focus your SEO and content efforts on fixing the leaks.
Conclusion
You've now moved beyond surface-level metrics and into the world of behavioral analysis. By creating custom exploration reports in GA4, you can tell the complete story of your SEO performance, from the initial search click to the final conversion.
Key Takeaways:
- Path Exploration is your tool for discovery. Use it to understand the real, unstructured paths organic users take, identify popular routes, and find dead ends.
- Funnel Exploration is your tool for measurement. Use it to track how organic users perform against a specific, ideal journey and to pinpoint high-friction drop-off points.
- The key to making these reports SEO-specific is to always start by applying a segment for organic traffic (
Session mediumcontainsorganic). - Reverse pathing is a powerful technique to identify the most valuable content and pages by working backward from a conversion event.
In our next lesson, we will learn how to create a custom SEO performance dashboard in Looker Studio. You'll take the insights from GSC and GA4—including the journey analyses we built today—and combine them into a single, automated dashboard that provides a comprehensive view of your SEO efforts for stakeholders.