Hello! Welcome back to our module on Advanced Analytics & Performance Reporting.
In our last lesson, we focused on the art of strategic communication. You learned how to define executive-level KPIs and design reports that translate complex SEO data into a compelling story about business impact. We moved from the "what" to the "why" of reporting.
Now, we'll tackle the "how" of making this process scalable and efficient. Manually exporting CSVs from Google Search Console, Ahrefs, and Google Analytics every week is not a sustainable strategy, especially for large-scale websites. It's time-consuming, prone to human error, and simply doesn't scale.
Today's lesson focuses on solving that problem. Your learning outcome is to automate the aggregation of SEO data from multiple sources into a centralized dashboard using APIs and data connectors. We will explore the technical foundations that allow your various marketing tools to talk to each other, feeding a single, always-up-to-date dashboard.
1. The Foundation of Automation: APIs and Data Connectors
At the heart of data automation are two key concepts: APIs and Data Connectors. Understanding the difference is crucial to choosing the right tool for the job.
-
APIs (Application Programming Interfaces): Think of an API as a direct line of communication to a tool's database. It's a set of rules that allows you to request specific data using code (like Python or JavaScript). This is the most powerful and flexible method, giving you full control over what data you get and how you get it. However, it requires some technical setup and scripting.
-
Data Connectors: A data connector is a pre-built bridge that uses an API on your behalf. When you add the "Google Search Console" data source in Looker Studio, you're using a connector. It provides a user-friendly interface, hiding the complexity of the API calls. This method is fast and easy but offers less customization than using the API directly.
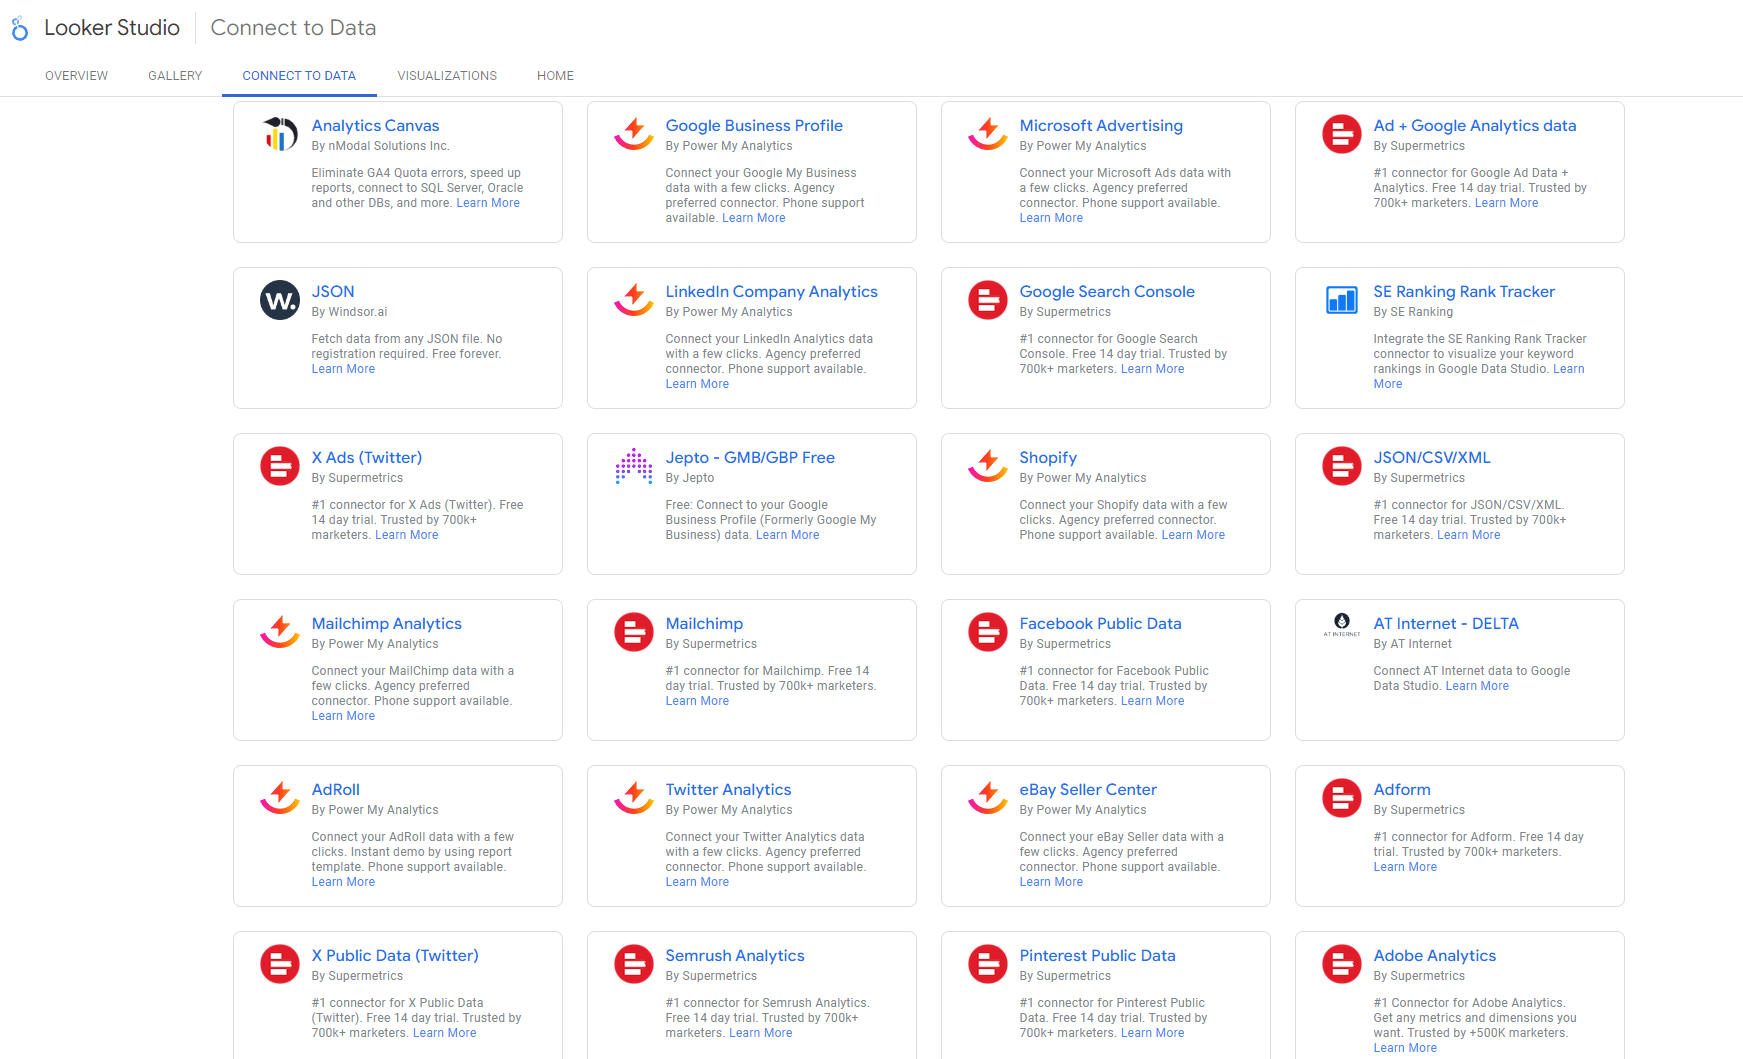
Your choice between using a direct API or a connector depends on your specific needs for customization, scalability, and your comfort with code.
2. Automating Your Core Data with the GSC API
Let's start with the most fundamental data source for any SEO: Google Search Console. While the built-in Looker Studio connector is useful, understanding how to work with the GSC API directly opens up a world of possibilities for custom automation and long-term data storage.
The following article from SearchX provides an excellent, practical overview of this process.
How to Automate SEO Reports with GSC API
This guide, 'How to Automate SEO Reports with GSC API,' walks through the entire process, from understanding the API's capabilities to scheduling automated data pulls.
Please read two key sections from this article: Start with 'Google Search Console API Overview' to understand what data is available and the main endpoints. Then, read the entire section 'How to Set Up Automated SEO Reports with GSC API' carefully. This section is the core of our lesson, covering API access, data extraction, and scheduling. Focus on the conceptual steps rather than memorizing code. Pay close attention to the distinction between 'OAuth 2.0' and 'Service Accounts' for authentication.
To summarize the key workflow from the article, automating GSC data pulls involves three main stages:
- Set Up API Access: This is done in the Google Cloud Console. You'll create a project, enable the GSC API, and generate credentials. For true automation, a Service Account is the best choice, as it acts like a "robot" user that doesn't require manual login or consent for each data pull.
- Extract the Data: You'll use a script (often in Python or Google Apps Script) to make a request to the API's Search Analytics endpoint. Your request specifies the site URL, date range, and the dimensions (e.g.,
query,page) and metrics (e.g.,clicks,impressions) you need. The data is returned in a structured format called JSON. - Schedule the Updates: Using a scheduler like a cron job on a server, or a cloud service like Google Cloud Functions, you run your script on a regular basis (e.g., daily). This script fetches the latest data and appends it to your destination, which could be a Google Sheet or, for more robust needs, a database.
An important consideration mentioned in the article is the 2-3 day data delay in the GSC API. Your automation script must account for this by requesting data from a few days in the past to ensure you're getting complete information.
3. Aggregating Data from Multiple Sources
Now that you understand how to automate a single source, let's address the main goal: aggregating multiple sources. You might want to combine GSC click data with Ahrefs backlink data and GA4 conversion data. There are two primary architectural patterns for this.
Method 1: Blending Data in Your BI Tool
This is the most direct approach. Most BI tools, including Looker Studio, allow you to "blend" or "join" data from different sources directly within the platform.

How it works:
- You add all your data sources to your Looker Studio report (e.g., a GSC connector, a GA4 connector, and a connector for Ahrefs).
- You create a "Blended Data" source.
- You select a "join key" – a dimension that exists in both datasets (like
DateorLanding Page). - Looker Studio merges the data, allowing you to create charts that show metrics from both sources side-by-side.
Pros: Quick to set up, doesn't require extra infrastructure.
Cons: Can become slow with large datasets, limited data transformation capabilities, and you're constrained by the live data limits of each connector (e.g., GSC's 16-month history).
Method 2: Centralizing in a Data Warehouse (The Enterprise Method)
For large-scale, long-term, and high-performance reporting, the best practice is to use a data warehouse. Instead of pulling data directly into your dashboard, you pull data from all your APIs into a central, high-performance database like Google BigQuery. Your dashboard then connects to this single, unified data source.
This approach gives you a permanent, historical archive of your data and the full power of SQL to clean, transform, and join it before it ever reaches the visualization layer. The article from Coupler.io on the Ahrefs API provides a perfect real-world example of this workflow.
How to Build Custom Dashboards with Ahrefs API
This article, 'Building Custom Dashboards with Ahrefs API,' demonstrates an advanced, scalable reporting architecture using Ahrefs, BigQuery, and Looker Studio.
Please read 'Use case 1 – competitors analysis.' Follow the data flow: a spreadsheet of competitors is synced to BigQuery, a script pulls Ahrefs API data for those competitors into BigQuery, and Looker Studio visualizes the final, combined data. This illustrates the data warehouse pattern perfectly.
The Data Warehouse Workflow:
- Extract: Your automation scripts pull data from the GSC API, Ahrefs API, GA4 API, etc.
- Load: The raw data is loaded into tables in a data warehouse like BigQuery.
- Transform: You use SQL queries within BigQuery to clean the data, join the different tables together, and create a final, analysis-ready "view".
- Visualize: Looker Studio connects to your final BigQuery view as a single, fast, and clean data source.
Pros: Highly scalable, extremely fast, enables long-term historical analysis (you bypass API data retention limits by storing it yourself), and allows for complex data transformations.
Cons: Requires more setup and infrastructure (though services like BigQuery are very accessible and cost-effective to start).
Test your understanding!
You've been asked to build a report tracking the long-term (3+ years) correlation between the number of new referring domains to key product pages (from Ahrefs) and their organic clicks (from GSC). Which data aggregation method would be more suitable and why?
Show answer
The Data Warehouse method (using BigQuery) is the only suitable option here. The GSC API and its Looker Studio connector are limited to 16 months of historical data. To perform a 3-year analysis, you must have been pulling data from both the GSC and Ahrefs APIs daily and archiving it in a permanent storage solution like BigQuery. Blending the data live in Looker Studio would not be able to access the older data.
4. No-Code Tools: The Best of Both Worlds
What if you want the power of a direct API connection without writing code? This is where no-code automation platforms like Coupler.io, Make.com, or Zapier come in. These tools provide a graphical interface to connect to APIs and send the data to a destination like Google Sheets or BigQuery.
Both articles you've reviewed mention Coupler.io. It acts as a user-friendly layer on top of the API, handling authentication, scheduling, and data routing for you. This is an excellent middle-ground, allowing you, the SEO specialist, to build powerful data pipelines without needing to become a developer. You can simply provide your API key, choose your metrics from a dropdown menu, select your destination, and set a schedule.
Conclusion
You've now seen how to evolve your reporting from a manual, time-consuming task into a scalable, automated system. By leveraging APIs and connectors, you can ensure your dashboards are always populated with fresh, accurate data from all your critical SEO tools.
Key Takeaways:
- Automation is achieved through APIs (for flexibility and power) and Data Connectors (for simplicity and speed).
- For simple reporting, you can blend data from multiple sources directly within a BI tool like Looker Studio.
- For scalable, long-term, and enterprise-level reporting, the best practice is to centralize all your data in a data warehouse like BigQuery before connecting it to your dashboard.
- No-code tools (e.g., Coupler.io, Make) provide a powerful way to access APIs and build automation pipelines without writing code.
You now have the aggregated data at your fingertips. But what does it all mean? In our final lesson for this module, you'll learn how to take this one step further by using AI prompts to generate summary insights and actionable recommendations from your aggregated report data, closing the loop from data collection to strategic action.