Hello! In our last lesson, we learned how to spot missing values in a dataset and understood why these empty gaps can cause big problems for our machine learning models. We compared it to trying to solve a puzzle with missing pieces—you can't see the full picture, and your model can't do its math.
Now that we know how to find the problem, it's time to learn how to fix it. Today, our goal is to apply simple strategies to handle missing values, specifically by either removing them or filling them in with a sensible guess. This is a crucial, hands-on step in cleaning our data and getting it ready for a machine learning model.
The Toolkit for Missing Data
When you find missing values, you have several tools at your disposal. Think of it like a toolkit for data repair.
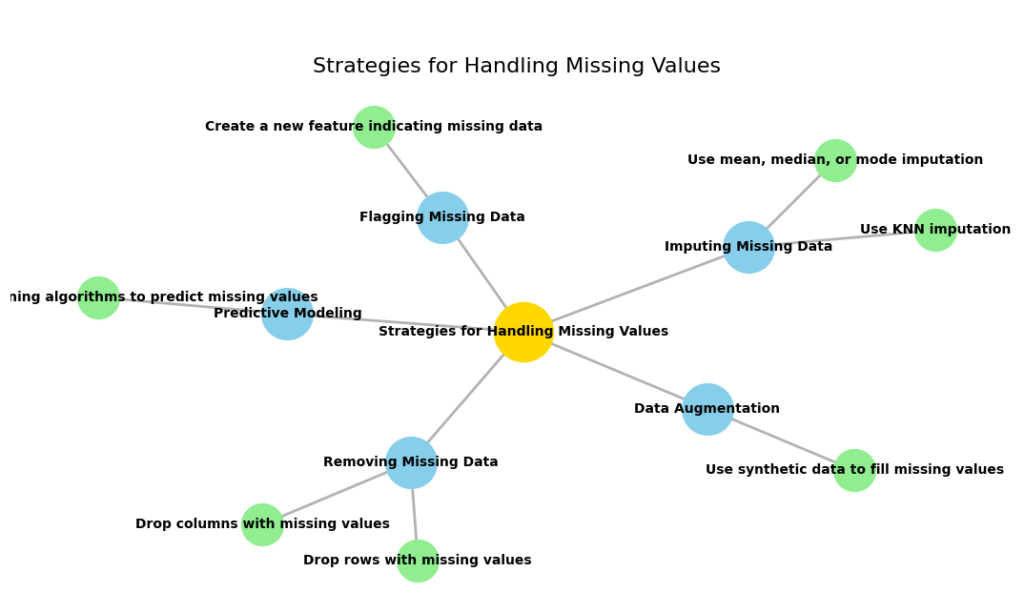
As the mind map suggests, there are two primary paths you can take:
- Omission (Deletion): Simply remove the data that has missing values.
- Imputation: Fill in the missing spots with a calculated value, or a "best guess."
Let's watch a quick overview that frames this choice.
Dealing with Missing Values in Machine Learning: Easy Explanation for Data Science Interviews
In this video, data scientist Emma Ding provides a clear, high-level overview of how to approach missing values.
Please watch the segment from omission and imputation, which introduces these two core concepts. Then, watch the short summary at the end, which explains how to decide which method to use.
Now, let's dive into each of these two strategies.
Strategy 1: Deletion (The "Throw It Away" Method)
The simplest and most direct way to handle missing values is to just get rid of them. This can be done in two ways:
- Deleting Rows: If a row (which represents a single observation, like one customer or one house) has a missing value, you can delete the entire row.
- Deleting Columns: If a column (which represents a feature, like 'Age' or 'Salary') has a lot of missing values, you might decide to delete the entire column.
This approach is fast and easy. However, it comes with a big risk: you might lose important information. If you throw away too many rows, you're giving your model less data to learn from. If the rows you're deleting aren't random, you could even introduce the bias we talked about in the last lesson.
So, when is it okay to use this method? The article we looked at in the last lesson gives us some good rules of thumb.
Top 4 Techniques for Handling Missing Values in Machine Learning
This article from the Paperspace blog explains the pros and cons of deleting data.
Please read the section titled Deleting Rows with Missing Values. Focus on the checklist under "When to use this technique," as it provides clear guidelines on when this approach is safe to use.
As the article states, deletion is generally safe only when you have a very large dataset and the amount of missing data is small. If a feature column is mostly empty (e.g., more than 70% missing), it's often useless, and deleting the whole column is a good choice.
Strategy 2: Imputation (The "Best Guess" Method)
Instead of throwing data away, we can try to fill in the gaps. This is called imputation. The idea is to replace the missing value with a reasonable substitute, so we can keep the row and the information it contains.

For a software engineer, you can think of imputation as replacing a null value with a sensible default before passing it to a function that doesn't accept nulls.
What makes a "sensible default"? Here are the three most common and simple choices:
- Mean: The average value of the column. You calculate the average of all the numbers that are there and use that to fill in the gaps. This is only for numerical data.
- Median: The middle value of the column (if you were to line all the numbers up in order). This is also for numerical data and is often a safer choice than the mean if you have outliers (a few extremely high or low values that could skew the average).
- Mode: The most frequent value in the column. This is the best choice for categorical data (like 'Color' or 'City'), where you can't calculate a mean or median. You simply find which category appears most often and use that.
Let's return to the same article to see when to use each of these.
Top 4 Techniques for Handling Missing Values in Machine Learning
This part of the article explains the most common imputation methods.
Read the section on Imputation Techniques. Pay close attention to the 💡 tips next to the definitions of mean, median, and mode. They give you the most important rule for choosing between them.
A Quick Look at a Practical Tool
Your goal is the AWS certification, and on AWS, you'll often use tools that make these tasks easier. For example, Amazon SageMaker Data Wrangler is a tool with a visual interface that lets you perform these cleaning steps without writing a lot of code.
This short video clip shows how you could use Data Wrangler to drop rows with missing values in just a few clicks.
Getting Started with SageMaker Data Wrangler to Analyze and Transform Data | AWS ML for Beginners
This video from Tiny Technical Tutorials demonstrates using AWS SageMaker Data Wrangler.
Watch this brief section to see how the "Handle Missing Data" transform is used to drop rows with missing data in the 'age' column. This shows how the concepts we're learning are applied in a real-world tool.
Data Wrangler can also be used to impute values using the mean, median, or a custom value, applying the very techniques we've discussed today.
Conclusion
Great job! You now know the two fundamental approaches for handling missing data. This is a skill you will use in almost every machine learning project.
Let's summarize the key takeaways:
- There are two simple strategies for handling missing values: deletion and imputation.
- Deletion (Omission): Involves removing rows or columns with missing data. It's fast but risky, as you can lose valuable information. It's best used when the amount of missing data is very small, or a column is mostly empty.
- Simple Imputation: Involves filling gaps with a calculated value.
- Use the mean for numerical data without extreme values (outliers).
- Use the median for numerical data that does have outliers.
- Use the mode (most frequent value) for categorical data.
- The choice between these methods depends on how much data is missing and whether it's missing in a random pattern.
In our last lesson, we learned to find the empty spots. Today, we learned how to fill or remove them. In our next lesson, we'll tackle another common data problem: what to do when a value isn't missing, but just looks... weird. We'll learn how to detect outliers—extreme values that can confuse our model—and what to do about them.