Introduction
Welcome to a new module, "Macroeconomic Analysis for Sri Lankan Investors." In the previous modules, we've focused on the "micro" level of investing: analyzing individual companies, reading charts, and understanding your own psychology as an investor. You've built a framework for making decisions about a single stock and managing your portfolio's risk.
Now, we zoom out to the "macro" level. No company or stock exists in a vacuum. They all operate within the broader environment of the national and global economy. Understanding this environment is like understanding the weather before you plan an outdoor activity; it provides the essential context for your decisions.
This lesson begins that journey by addressing the learning outcome: Explain how GDP growth, unemployment, and inflation data influence the stock market.
We will explore the relationship between the economy and the stock market, define three of the most critical economic indicators, and see how their movements can signal opportunities and risks for investors. Your background in monitoring complex systems will be helpful here, as we'll be looking at how different data points signal the overall health of the economic system.
Part 1: The Big Picture: Economy vs. Stock Market
It's a common misconception that the stock market is the economy. While they are linked, they are not the same thing. The stock market is a collection of publicly traded companies, while the economy represents the total production and consumption of goods and services in a country.
A helpful way to visualize their relationship is the "man walking the dog" analogy.
The Difference Between The Stock Market And The Economy
This video from CNBC provides an excellent analogy to understand the relationship between the economy and the stock market. It also highlights why they don't always move in lockstep in the short term.
Please watch the video from 00:50 to 06:21. Pay attention to: The 'man walking the dog' analogy (00:50). The historical examples of when the market and economy diverged (02:01). The concept of the market as a 'leading indicator' that is sometimes wrong (03:03). The many other variables besides economic data that affect stock prices (04:26).
The key takeaways from the video are:
- The Economy is the Man, the Stock Market is the Dog: The economy (the man) moves in a relatively steady, slow-moving trend. The stock market (the dog) is much more volatile, running ahead, falling behind, and darting from side to side. Over the long term, they both end up at the same destination, but their short-term paths can look very different.
- The Market is Forward-Looking: Stock prices don't reflect what the economy is doing today; they reflect what investors expect it to do in the next 6-12 months. This is why the market can rise even when economic news is bad—investors may believe the worst is over and are "pricing in" a future recovery.
This concept of the market being "forward-looking" while economic data is "backward-looking" is fundamental. Let's explore it further.
Stock Markets and Economic Data (Correlation)
The 'Financial Wisdom' channel provides a clear, chart-based explanation of why the stock market is considered a 'leading indicator' for the economy.
Watch from 00:57 to 04:24. Focus on how the charts show the stock market (S&P 500) consistently peaking and bottoming before the official start and end of economic recessions, which are defined by GDP data.
In your work as a TechOps Engineer, you can think of it like this: Economic data like GDP reports are like historical logs or performance reports—they tell you exactly what happened in the last quarter. The stock market, on the other hand, is more like a predictive monitoring system, trying to forecast future system health based on a wide array of inputs and expectations. It's an imperfect forecast, but its job is to anticipate, not to report on the past.
Defining the Key Economic Indicators
Now that we understand this relationship, let's define the three key indicators for this lesson. They are often referred to as macroeconomic indicators.
Economic Indicators Explained : GDP Growth, Inflation, Unemployment, and Interest Rates
This guide from Ventura Securities provides clear, concise definitions of GDP, inflation, and unemployment, and explains why each one matters to the economy and to investors. We will go through them one by one.
Please read the first three main sections of the article: 'GDP Growth: Measuring Economic Performance' 'Inflation: Understanding the Rise in Prices' 'Unemployment: Understanding Labor Market Health' \nFocus on the 'What is...?' and 'Why It Matters' parts for each indicator.
Let's summarize and connect these to the stock market.
1. Gross Domestic Product (GDP) Growth
- What it is: The total value of all goods and services produced in a country. GDP growth is the rate at which this value is increasing.
- Influence on the Stock Market:
- Positive: Strong GDP growth means the economy is expanding. Companies are selling more, leading to higher revenues and profits. Higher profits generally lead to higher stock prices and more capacity for dividends. This boosts investor confidence.
- Negative: Weak or negative GDP growth (a recession) means the economy is shrinking. Corporate profits fall, companies may lay off workers, and investors become fearful, leading to stock market declines.
2. Inflation
- What it is: The rate at which the general level of prices is rising, eroding the purchasing power of money.
- Influence on the Stock Market: This is more complex.
- Moderately Positive: A small, stable amount of inflation (e.g., 2-3%) is often seen as a sign of a healthy, growing economy where demand is strong. This is generally good for stocks.
- Negative: High inflation is a major threat. It increases costs for businesses (raw materials, wages), which can squeeze profit margins. It also reduces the real value of future profits. Most importantly, it often forces central banks to raise interest rates to cool down the economy, which makes borrowing more expensive for companies and makes safer investments like bonds more attractive relative to stocks.
3. Unemployment Rate
- What it is: The percentage of the labor force that is jobless but actively looking for work.
- Influence on the Stock Market:
- Positive: A low unemployment rate means more people have jobs and income. This fuels consumer spending, which is a major driver of revenue for most companies. This is bullish (positive) for the stock market.
- Negative: A high unemployment rate means fewer people are earning and spending. This reduces demand for goods and services, hurting corporate profits and leading to bearish (negative) market sentiment.
(This is a good point to take a break. The first part covers the foundational concepts and definitions, taking approximately 30 minutes.)
Part 2: The Interplay and a Sri Lankan Case Study
These indicators don't exist in isolation. They influence each other in a dynamic, sometimes contradictory, way.
The Complex Interactions
Think of these indicators as interconnected components in a large, complex system. A change in one can cause a ripple effect.
Economic Indicators Explained : GDP Growth, Inflation, Unemployment, and Interest Rates
Let's return to the Ventura Securities article to understand how these indicators interact with each other.
Please read the final section, 'How These Macroeconomic Indicators Interact'. This section summarizes the cause-and-effect relationships between them.
A common cycle looks like this:
- Strong GDP growth leads to...
- ...very low unemployment as companies hire more workers.
- This strong demand and tight labor market can lead to rising inflation.
- The central bank then raises interest rates to fight inflation.
- Higher interest rates slow down GDP growth, and the cycle begins again.
This interplay means you can't look at just one number. For example, strong GDP growth is good, but if it comes with dangerously high inflation, the market might fall in anticipation of future interest rate hikes.
A Special Case: Stagflation
Sometimes, the worst of both worlds happens: the economy stagnates (low or negative GDP growth, high unemployment) while inflation remains high. This toxic mix is called stagflation.
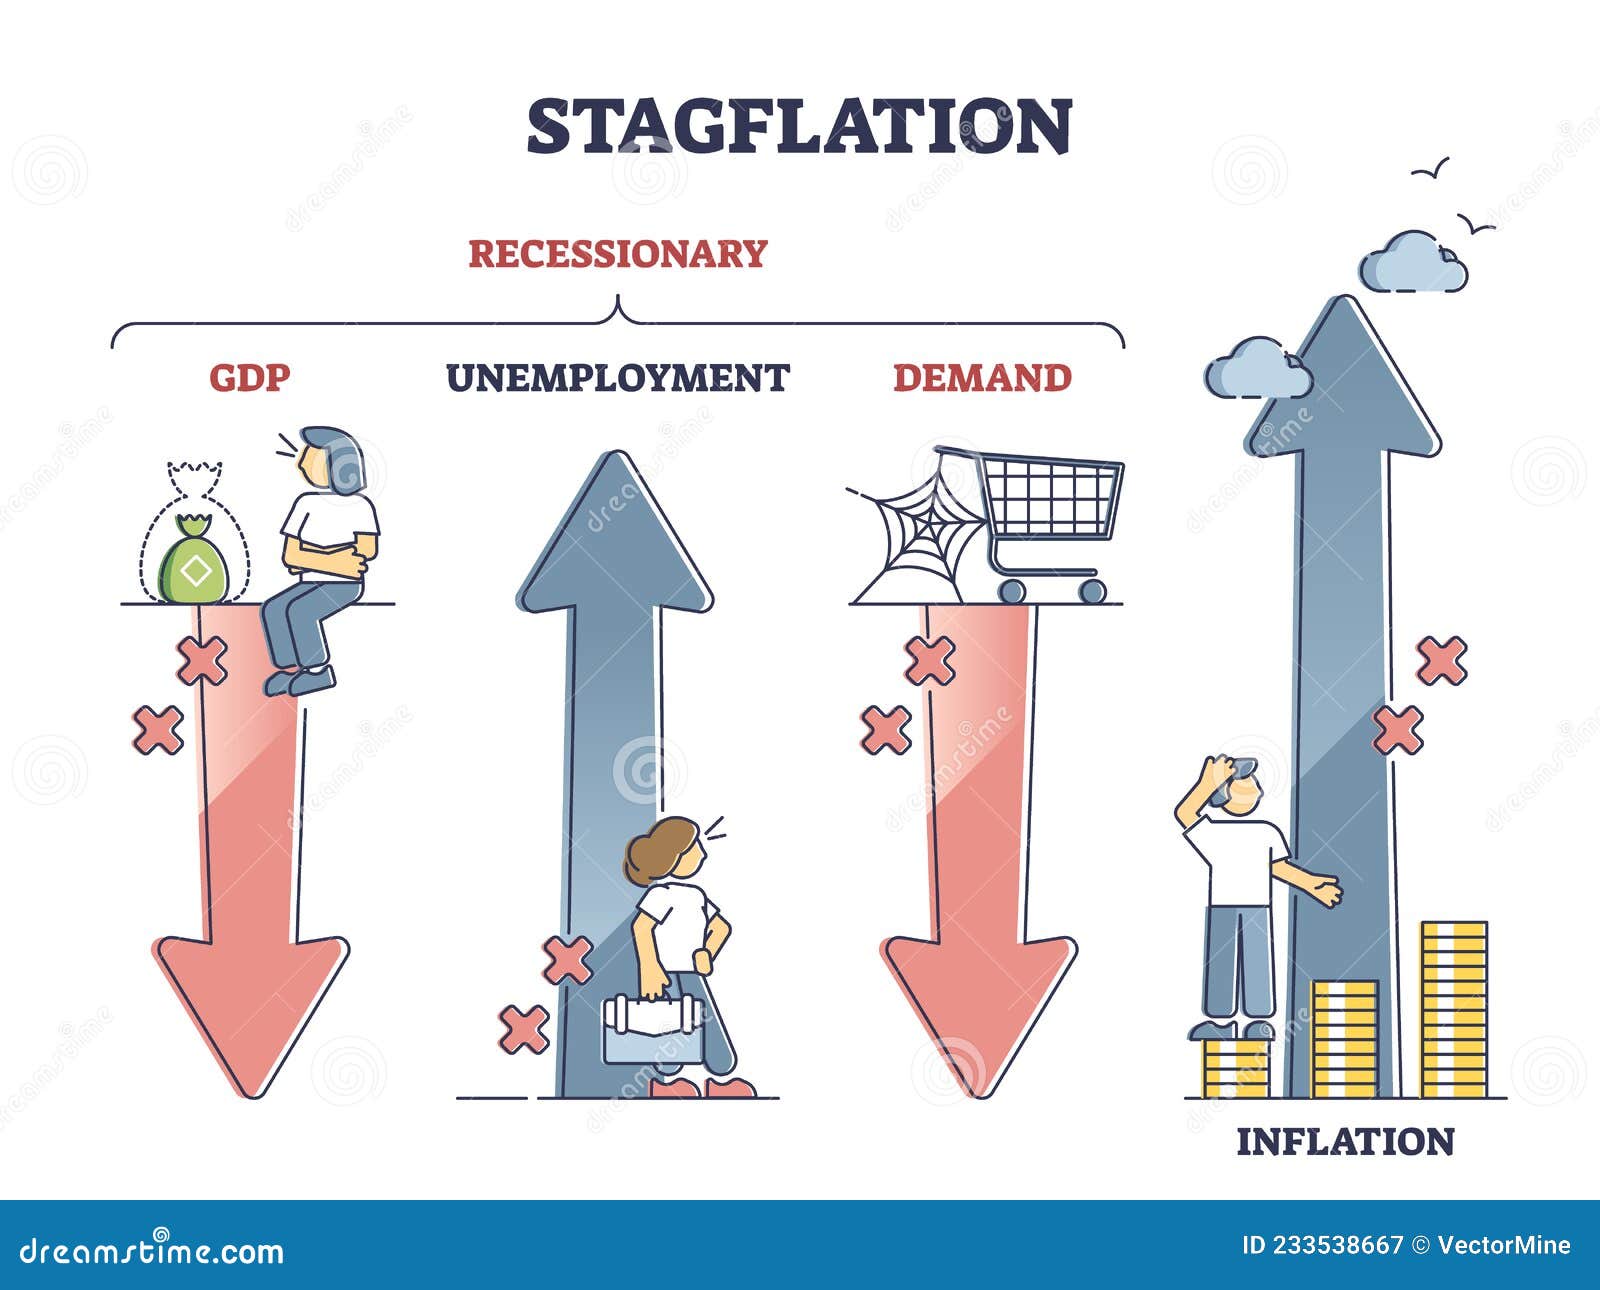
Stagflation is particularly damaging for stocks because company profits are hit from two sides: falling sales due to the recession, and rising costs due to inflation.
A Real-World Example: Sri Lanka's Recent Economic Turnaround
These concepts can feel abstract. Let's make them concrete by looking at how they played out in Sri Lanka—and on the Colombo Stock Exchange (CSE)—in the recent past.

Now, let's read an analysis that connects these economic events directly to the stock market's performance.
Sri Lanka: From Stability to Growth
This article from International Banker, titled 'Sri Lanka: From Stability to Growth', provides a fantastic case study of how the CSE reacted to shifts in Sri Lanka's macroeconomic indicators.
Read the article, paying close attention to the timeline: The description of the economic crisis and its causes (Section starting 'At the end of 2018...'). The role of the Central Bank of Sri Lanka (CBSL) in fighting inflation with aggressive interest rate hikes (Section starting 'One of the key actors...'). The direct link between achieving macroeconomic stability (lower inflation, stabilizing currency) and the massive rally in the CSE All-Share Index (Section starting 'The combination of macroeconomic stability...').
This article demonstrates our lesson perfectly:
- Economic Crisis (High Inflation, Negative GDP): The period leading up to and including 2022 was marked by immense economic hardship. As the infographic shows, inflation skyrocketed and GDP contracted. This was a disastrous environment for businesses.
- Policy Response (Interest Rate Hikes): The Central Bank of Sri Lanka (CBSL) took aggressive action, raising interest rates to control inflation. This was painful in the short term but was necessary to restore stability.
- Market Recovery (Forward-Looking): Starting in 2023, as inflation began to fall and the economy showed signs of stabilizing, the stock market didn't wait for GDP to turn strongly positive. It began to rally in anticipation of a future recovery.
- Bull Market (Improving GDP, Lower Inflation): The CSE All-Share Index produced enormous returns as the economic picture improved. Restored stability and the prospect of future growth (improving GDP) brought investors back, leading to a significant "re-rating" of Sri Lankan stocks.
This real-world example, directly relevant to your goal of investing in the CSE, shows that understanding the macroeconomic trend is crucial.
Conclusion
In this lesson, we have moved from the micro-level of individual companies to the macro-level of the entire economy. We've seen that while the stock market and the economy are connected, they don't move in perfect sync because the market is always trying to look ahead.
Key Takeaways:
- The stock market is a forward-looking "dog" that tries to anticipate the path of the more stable, backward-looking "man" which is the economy.
- GDP growth is a primary measure of economic health. Strong growth is generally bullish for stocks as it fuels corporate profits.
- Low unemployment is also bullish, as it means more consumer spending power, which drives company revenues.
- Inflation has a dual effect: moderate inflation can signal a healthy economy, but high inflation is a major negative for stocks as it erodes profits and leads to higher interest rates.
- The recent performance of the Colombo Stock Exchange provides a powerful case study of a market bottoming and then rallying sharply as macroeconomic stability (falling inflation, stabilizing currency) was restored, well ahead of a full economic recovery.
Preview of the Next Lesson:
We saw in the Sri Lankan example that the actions of the Central Bank (monetary policy) were critical. But they are not the only major player. The government itself has powerful tools to influence the economy.
In our next lesson, we will explore this further: "Describe how government fiscal policy (taxation, spending) affects businesses and markets in Sri Lanka." We will examine how budget decisions, tax changes, and government spending projects can create tailwinds or headwinds for different sectors of the stock market.