Introduction
Welcome back! In our previous lesson, we established the two major philosophical approaches to stock valuation: absolute valuation, which seeks to determine a company's intrinsic worth based on its own fundamentals, and relative valuation, which compares a company's price to that of its peers.
This lesson moves from theory to practice. We will focus on the most widely used tools for relative valuation, which serve as a quick first check to gauge if a stock is potentially cheap or expensive. By the end of this lesson, you will be able to calculate and interpret two key valuation ratios: the Price-to-Earnings (P/E) ratio and the Price-to-Book (P/B) ratio.
Understanding these ratios is a fundamental skill for any investor, providing a starting point for nearly all valuation analysis.
1. The Price-to-Earnings (P/E) Ratio: Paying for Profits
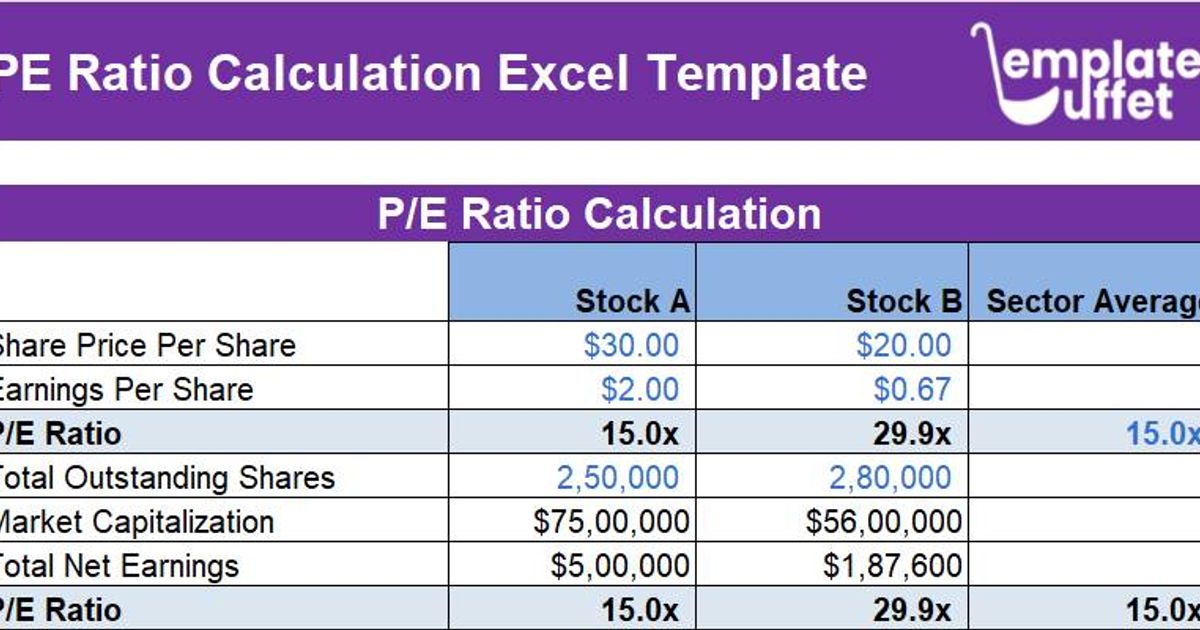
The P/E ratio is arguably the most famous valuation metric. It answers a simple question: "How much is the market willing to pay today for every one rupee of a company's annual profit?"
Calculating the P/E Ratio
The formula is straightforward:
- Market Price per Share: This is the current stock price you see on the exchange.
- Earnings per Share (EPS): As we learned when studying the income statement, this is the company's total net profit divided by the number of outstanding shares. It represents the profit attributable to each share.
Your background with data tools like Tableau and Power BI involves creating calculated fields and ratios to derive insights—this is the exact same principle applied to financial data.
The image below shows how this is calculated in a simple spreadsheet format, which might feel familiar.
Interpreting the P/E Ratio
A P/E ratio, such as 15x, means that investors are currently paying LKR 15 for every LKR 1 of the company's annual earnings. But is 15x high or low? That's where interpretation begins.
To get a solid grasp of the P/E ratio, let's watch a short video that explains the concept, calculation, and—most importantly—the comparative nature of this metric.
PE Ratio Explained Simply | Finance in 5 Minutes!
This video from the Rynance channel provides a clear, simple explanation of the P/E ratio.
Please watch from the beginning until 04:31. Focus on: The core definition of the P/E ratio (0:00 - 1:02). The calculation example (1:02 - 2:15). The crucial concept of comparing companies within the same industry (2:15 - 4:31).
As the video highlights, a P/E ratio is not very useful in isolation. Its power comes from comparison.
- A high P/E ratio can suggest that investors expect high future earnings growth, so they are willing to pay a premium. Tech companies often have high P/E ratios for this reason. It could also mean the stock is overvalued.
- A low P/E ratio can suggest that a stock is undervalued. However, it could also signal that the market has low expectations for future growth or that the company is facing significant risks. This is often called a "value trap."
P/E Ratios in the Sri Lankan Context
To make this practical for your goal of investing in the CSE, you must understand what these ratios mean specifically in the Sri Lankan market. Local economic conditions, industry dynamics, and investor sentiment all influence valuation.
The following reading provides excellent context for interpreting P/E ratios in Sri Lanka.
Understanding PE Ratios & Valuations in a Sri Lankan Context
This article from Innovest Investments, titled 'Understanding PE Ratios & Valuations in a Sri Lankan Context', directly applies the concept to the CSE.
Please read the article from the beginning down to the section 'Sector-Wise PE Trends in Sri Lanka (2025)'. Pay close attention to: How Sri Lanka's average market P/E compares to regional peers. The difference between low P/E (e.g., plantation companies) and high P/E (e.g., logistics) stocks on the CSE. The sector-specific P/E ranges for key industries like Banking and Consumer Staples.
This local context is critical. A P/E of 8x might be considered low for a tech company in the US but could be normal for a bank on the CSE, especially given the recent economic climate.
2. The Price-to-Book (P/B) Ratio: Paying for Assets
While P/E focuses on profits, the Price-to-Book (P/B) ratio focuses on a company's net assets. It answers the question: "How much is the market willing to pay for the company's net assets as recorded on its books?"
Calculating the P/B Ratio
The formula for the P/B ratio is:
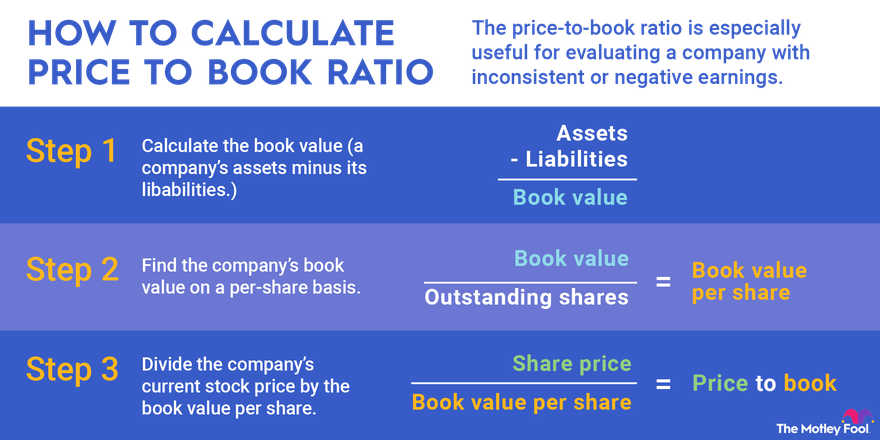
- Book Value per Share: This is derived from the balance sheet. Book Value (also known as Shareholders' Equity) is calculated as Total Assets - Total Liabilities. To get the per-share value, you divide this total Book Value by the number of outstanding shares.
This infographic breaks down the calculation into three clear steps.
Interpreting the P/B Ratio
The P/B ratio tells you how many times the market is valuing the company over its accounting (book) value.
Let's watch another video from the same channel to understand its interpretation and when it is most useful.
Price to Book Ratio Explained (P/B) | Finance In 5 Minutes!
This video, 'Price to Book Ratio Explained', will clarify the P/B ratio's meaning, its application, and important red flags to watch for.
Please watch from the beginning until 04:54. Focus on: The definition of Book Value (what it includes and excludes). Why P/B is more useful for asset-heavy industries (like banks) than for asset-light ones (like tech). The interpretation of different P/B multiples. The special meaning when P/B is less than 1 or negative.
Key interpretation points from the video:
- P/B > 1: The market values the company at more than its net asset value. This is common, as investors believe management can use those assets to generate future profits far exceeding their cost.
- P/B < 1: The stock is trading for less than the accounting value of its assets. This could mean the stock is deeply undervalued—a potential bargain. Alternatively, it could mean the market believes the company's assets are obsolete or worth less than their value on the balance sheet.
- When is P/B most useful? It's particularly relevant for companies with significant tangible assets, such as banks, insurance companies, and industrial manufacturers. Banks are a major sector on the CSE, making P/B an important ratio for you to understand.
Putting It All Together: A Comparison
P/E and P/B are both relative valuation ratios, but they measure a company's price against two different fundamentals: earnings and assets. They are complementary, not competing, metrics.
Here's a summary table that contrasts the two:
| Basis of Difference | Price-to-Earnings (P/E) Ratio | Price-to-Book (P/B) Ratio |
|---|---|---|
| Focus | Compares market price to company profits. | Compares market price to company net assets. |
| Core Question | "How much am I paying for LKR 1 of earnings?" | "How much am I paying for LKR 1 of book value?" |
| Best Used For | Most companies with consistent, positive earnings. | Asset-heavy industries (banks, insurance, manufacturing). |
| A "Low" Ratio May Mean | Undervalued, or poor growth prospects / high risk. | Undervalued, or assets are impaired / generate poor returns. |
| A "High" Ratio May Mean | Overvalued, or high growth expectations. | Overvalued, or the company generates high returns on its assets. |
Crucial Caveat: Never rely on a single ratio to make an investment decision. A low P/E stock might have a huge amount of debt (which P/E ignores). A low P/B stock might have negative earnings. Always use these ratios as a starting point for deeper analysis.
Conclusion
Congratulations! You have now learned how to calculate and interpret the two most fundamental relative valuation ratios in finance.
Key Takeaways:
- P/E Ratio measures the price of a stock relative to its annual earnings (profits). A high P/E often indicates growth expectations, while a low P/E might signal undervaluation or risk.
- P/B Ratio measures the price of a stock relative to its book value (net assets). It is especially useful for asset-heavy industries like banking. A P/B below 1 can indicate a potential bargain.
- The power of these ratios lies in comparison—against industry peers, the company's own history, and the broader market.
- Context is everything. The interpretation of a P/E or P/B ratio for a company on the Colombo Stock Exchange depends on its sector, the economic environment, and overall market sentiment.
Preview of the Next Lesson:
Knowing the theory is one thing; applying it is another. In our next lesson, we will move into a practical exercise: Applying relative valuation using P/E and P/B multiples to compare stocks within an industry. We will select a few real companies from the CSE, find their financial data, calculate these ratios, and analyze what they tell us about their relative valuations.