Introduction
Welcome back! In our last lesson, we defined and learned how to calculate the Price-to-Earnings (P/E) and Price-to-Book (P/B) ratios. You learned that these metrics provide a snapshot of a company's valuation relative to its profits and assets, respectively. We also touched upon the importance of local context, particularly for the Colombo Stock Exchange (CSE).
This lesson takes the next logical step: putting theory into practice. A valuation ratio is of little use in isolation. Its true power is unlocked through comparison. Today, you will learn how to apply relative valuation using P/E and P/B multiples to compare stocks within an industry. This is a fundamental skill for screening potential investments and forming an initial opinion on whether a stock is priced cheaply or expensively compared to its peers.
1. The Cardinal Rule: Compare Apples to Apples
Before we dive into the numbers, we must establish the most important principle of relative valuation: only compare similar companies.
As we saw in the previous lesson's materials, comparing the P/E ratio of a mature banking company to a high-growth technology firm is misleading. Their business models, growth prospects, and capital requirements are fundamentally different, which naturally leads to different "normal" valuation ranges.
Therefore, effective comparison happens at the industry level. For your goal of investing in the CSE, this means comparing a bank to other banks, a food & beverage company to its competitors, or a manufacturing firm to other manufacturers.
The Innovest Investments article you read previously highlighted this by providing typical P/E ranges for different sectors in Sri Lanka, such as:
- Banking: 4x–6x
- Consumer Staples: 10x–14x
- Plantations: 3x–5x
This reinforces that what is considered "high" or "low" is entirely dependent on the industry context.
2. Using P/E and P/B for Direct Comparison
Let's see how this comparison works in practice. We'll look at how to evaluate two companies side-by-side using their P/E and P/B ratios.
How to Compare Stocks Using Valuation Ratios
This short clip from Charles Schwab provides a concise visual demonstration of comparing two companies using P/E and P/B ratios.
Please watch the following two segments: The P/E ratio comparison (0:21 - 0:49). The P/B ratio comparison (1:53 - 2:17). \nFocus on how a lower multiple is generally preferred by value investors.
As the video illustrates, when all else is equal, a company with lower P/E and P/B ratios relative to a peer appears to be a better value. You are paying less for each unit of earnings (P/E) and each unit of net assets (P/B).
Let's look at a more detailed, real-world example.
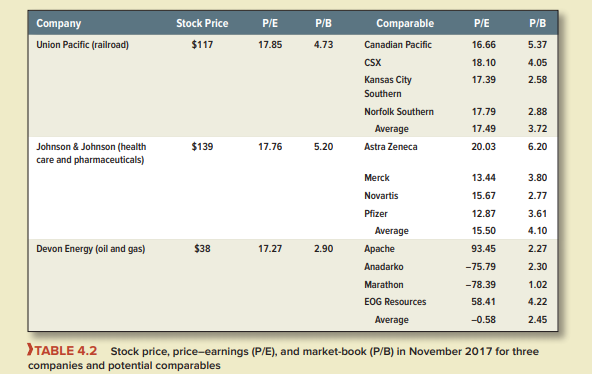
Let's analyze the first company, Union Pacific (a railroad company):
- P/E Ratio: Union Pacific's P/E is 20.3x. The average P/E for the railroad industry is 20.9x. This tells us Union Pacific is valued very closely to its industry average. It's neither significantly cheaper nor more expensive than its peers on an earnings basis.
- P/B Ratio: Union Pacific's P/B is 4.1x. The industry average P/B is 3.5x. Here, we see a difference. Union Pacific is trading at a slight premium to its peers based on its book value. This could mean investors believe Union Pacific's management is more effective at generating profit from its assets than its competitors are, thus deserving a higher valuation.
This is the process of relative valuation: comparing a company's multiples to a relevant benchmark (the industry average or direct competitors) to identify potential over or undervaluation.
3. A Practical Walkthrough: Comparing Two Banks on the CSE
Now, let's apply this to your specific goal of investing in Sri Lanka. The banking sector is a dominant part of the CSE, and as we've learned, P/B is particularly useful for asset-heavy businesses like banks.
Imagine we are comparing two (fictional) Sri Lankan banks: "Lanka National Bank" (LNB) and "Commerce Bank of Ceylon" (CBC).
Here is their financial data:
| Metric | Lanka National Bank (LNB) | Commerce Bank of Ceylon (CBC) | Industry Average |
|---|---|---|---|
| Share Price | LKR 90 | LKR 125 | - |
| Earnings Per Share (EPS) | LKR 18 | LKR 22 | - |
| Book Value Per Share | LKR 150 | LKR 180 | - |
At first glance, LNB's share price is lower. But as you know, share price alone is not a measure of value. Let's calculate the P/E and P/B ratios.
Step 1: Calculate the Ratios
-
Lanka National Bank (LNB):
- P/E = LKR 90 / LKR 18 = 5.0x
- P/B = LKR 90 / LKR 150 = 0.60x
-
Commerce Bank of Ceylon (CBC):
- P/E = LKR 125 / LKR 22 = 5.68x
- P/B = LKR 125 / LKR 180 = 0.69x
Step 2: Compare and Analyze
Let's assume the average P/E for the Sri Lankan banking sector is 6.0x and the average P/B is 0.75x.
| Metric | Lanka National Bank (LNB) | Commerce Bank of Ceylon (CBC) | Industry Average | Analysis |
|---|---|---|---|---|
| P/E Ratio | 5.0x | 5.68x | 6.0x | Both banks are trading below the industry average P/E. LNB appears slightly cheaper based on its earnings. |
| P/B Ratio | 0.60x | 0.69x | 0.75x | Both banks are trading below their book value (P/B < 1) and below the industry average. LNB appears cheaper based on its net assets. |
Step 3: Synthesize the Findings
Based purely on this relative valuation, Lanka National Bank (LNB) appears to be the more attractively valued stock. It trades at a lower multiple of both its earnings and its book value compared to both its competitor (CBC) and the industry average.
Crucial Caveat: This does not automatically mean LNB is the better investment. It is a starting point for more questions. Why is it cheaper?
- Does it have lower growth prospects?
- Does it have a higher percentage of risky loans on its books?
- Is its management team less regarded by the market?
The Innovest article you read previously warned against the misconception that a "lower PE is always better." A low multiple can be a sign of a "value trap"—a company that appears cheap for very good reasons. This is why valuation is just one part of a comprehensive analysis.
4. Going Deeper: The Link Between Profitability and Valuation
Your background in data analysis allows us to appreciate a deeper layer of this comparison. A company's valuation multiple isn't random; it's often linked to its financial performance, especially its profitability.
A key profitability metric is Return on Equity (ROE), which we will cover in detail later. For now, just know that ROE measures how much profit a company generates for each rupee of shareholder's equity.
Generally, a company that is more profitable (has a higher ROE) should command a higher P/B ratio. The market is willing to pay a premium for assets that are used more effectively.
Look at the chart below.

This chart plots various companies based on their ROE (x-axis) and their P/B ratio (y-axis). The regression line (dashed line) shows the average or "fair" P/B ratio for a company with a certain ROE.
How to use this for analysis:
- A company that falls significantly below the line might be considered undervalued. Its P/B ratio is lower than what its profitability (ROE) would suggest is fair.
- A company that is far above the line might be overvalued. Its P/B ratio is much higher than what its level of profitability seems to justify.
This adds a powerful layer of nuance to relative valuation, helping you decide if a high or low multiple is truly justified.
Conclusion
In this lesson, you have moved from knowing what P/E and P/B ratios are to actively using them as analytical tools.
Key Takeaways:
- The foundation of relative valuation is comparing a company to its direct peers and industry averages.
- By calculating and comparing P/E and P/B ratios, you can quickly identify which stocks in a sector appear cheap or expensive relative to others.
- A lower multiple may indicate undervaluation, but it's critical to ask why the stock is cheap to avoid value traps.
- Valuation multiples are often linked to underlying performance metrics like profitability (ROE), adding another dimension to your analysis.
Preview of the Next Lesson:
We have now established a framework for comparison. In the next lesson, we will synthesize these ideas to address the learning outcome: Identify when a stock may be overvalued or undervalued based on relative valuation analysis. We will delve deeper into interpreting the results of our comparisons, discussing what makes a "good" low P/E stock versus a value trap, and what justifies a high P/E ratio.