Introduction
Welcome to the next lesson in our module on technical analysis. In our previous session, you learned how to interpret key indicators derived from a stock's price: Moving Averages (MA) for trend direction, the Relative Strength Index (RSI) for measuring price extremes, and the Moving Average Convergence Divergence (MACD) for identifying shifts in momentum. These tools give us a sophisticated view of price action.
However, price is only one half of the story. The other half is volume. This lesson focuses on the learning outcome: Explain the importance of trading volume in confirming price trends.
Think of it this way: if price data tells you what happened, trading volume tells you the degree of conviction or participation behind that event. In your work with data systems, you know that a conclusion drawn from a large, robust dataset is more reliable than one from a small, noisy sample. Volume provides a similar function in trading; it acts as a validation layer for price movements.
By the end of this lesson, you will understand how to use volume to confirm the strength of trends, identify potential reversals, and distinguish between genuine breakouts and false signals.
1. What is Trading Volume?
At its core, trading volume is simply the total number of shares of a stock traded during a specific time period (e.g., a day, an hour). It is a direct measure of market activity and interest in a particular stock.
On a stock chart, volume is typically displayed as a series of vertical bars at the bottom, directly below the price candles.
To get a clear understanding of what volume represents and how it appears on a chart, let's watch a short video.
🛑 STOP Trading Until You Learn VOLUME ANALYSIS...
The video 'STOP Trading Until You Learn VOLUME ANALYSIS...' by Mind Math Money provides a concise definition of trading volume and how it is represented on a chart.
Please watch from 00:37 to 04:16. Focus on: The simple definition of volume. How the height and color of the volume bars correspond to the day's trading activity and price action. The crucial example at 03:20, which illustrates why a price move on high volume is much more significant than the same move on low volume.
As the video explained, the key idea is that volume indicates the strength or force behind a price move. A popular saying in technical analysis is "volume equals validity." A price trend accompanied by high and increasing volume is considered strong and more likely to continue. Conversely, a trend on low and declining volume is seen as weak and may be prone to reversal.
2. The Four Key Price-Volume Scenarios
The relationship between price and volume can be distilled into four primary scenarios. Understanding these combinations is fundamental to using volume in your analysis.
We will use a comprehensive article from Investopedia to explore these scenarios.
Understanding Trading Volume: Key Indicators and Impacts on ...
The article 'Understanding Trading Volume' from Investopedia provides excellent, clear examples for each of the four main price-volume relationships. It will serve as a great reference guide.
Please read the section titled 'Analyzing Trading Volume: Techniques and Insights' and the four subsections that follow it ('What Rising Prices With Increasing Volume Indicate,' 'Analyzing the Impact of Rising Volume on Falling Prices,' etc.). Focus on how each combination of price and volume is interpreted.
Here is a summary of those four scenarios, which you can use as a quick reference. This framework is one of the most practical applications of volume analysis.
| Price Action | Volume Action | Interpretation & Meaning |
|---|---|---|
| Rising | Rising | Bullish Confirmation: Strong buying interest. The uptrend is healthy and likely to continue. |
| Rising | Falling | Bearish Divergence: Weakening buying interest. The uptrend is losing momentum and may be nearing a reversal. |
| Falling | Rising | Bearish Confirmation: Strong selling pressure. The downtrend is healthy and likely to continue. |
| Falling | Falling | Bullish Divergence: Weakening selling pressure. The downtrend may be losing steam, potentially leading to a bottom. |
This table is based on the logic presented in both the Investopedia article you just read and the Wealthsimple article "Volume Analysis: Confirming Stock Trends and Spotting Big Moves."
Volume and Breakouts
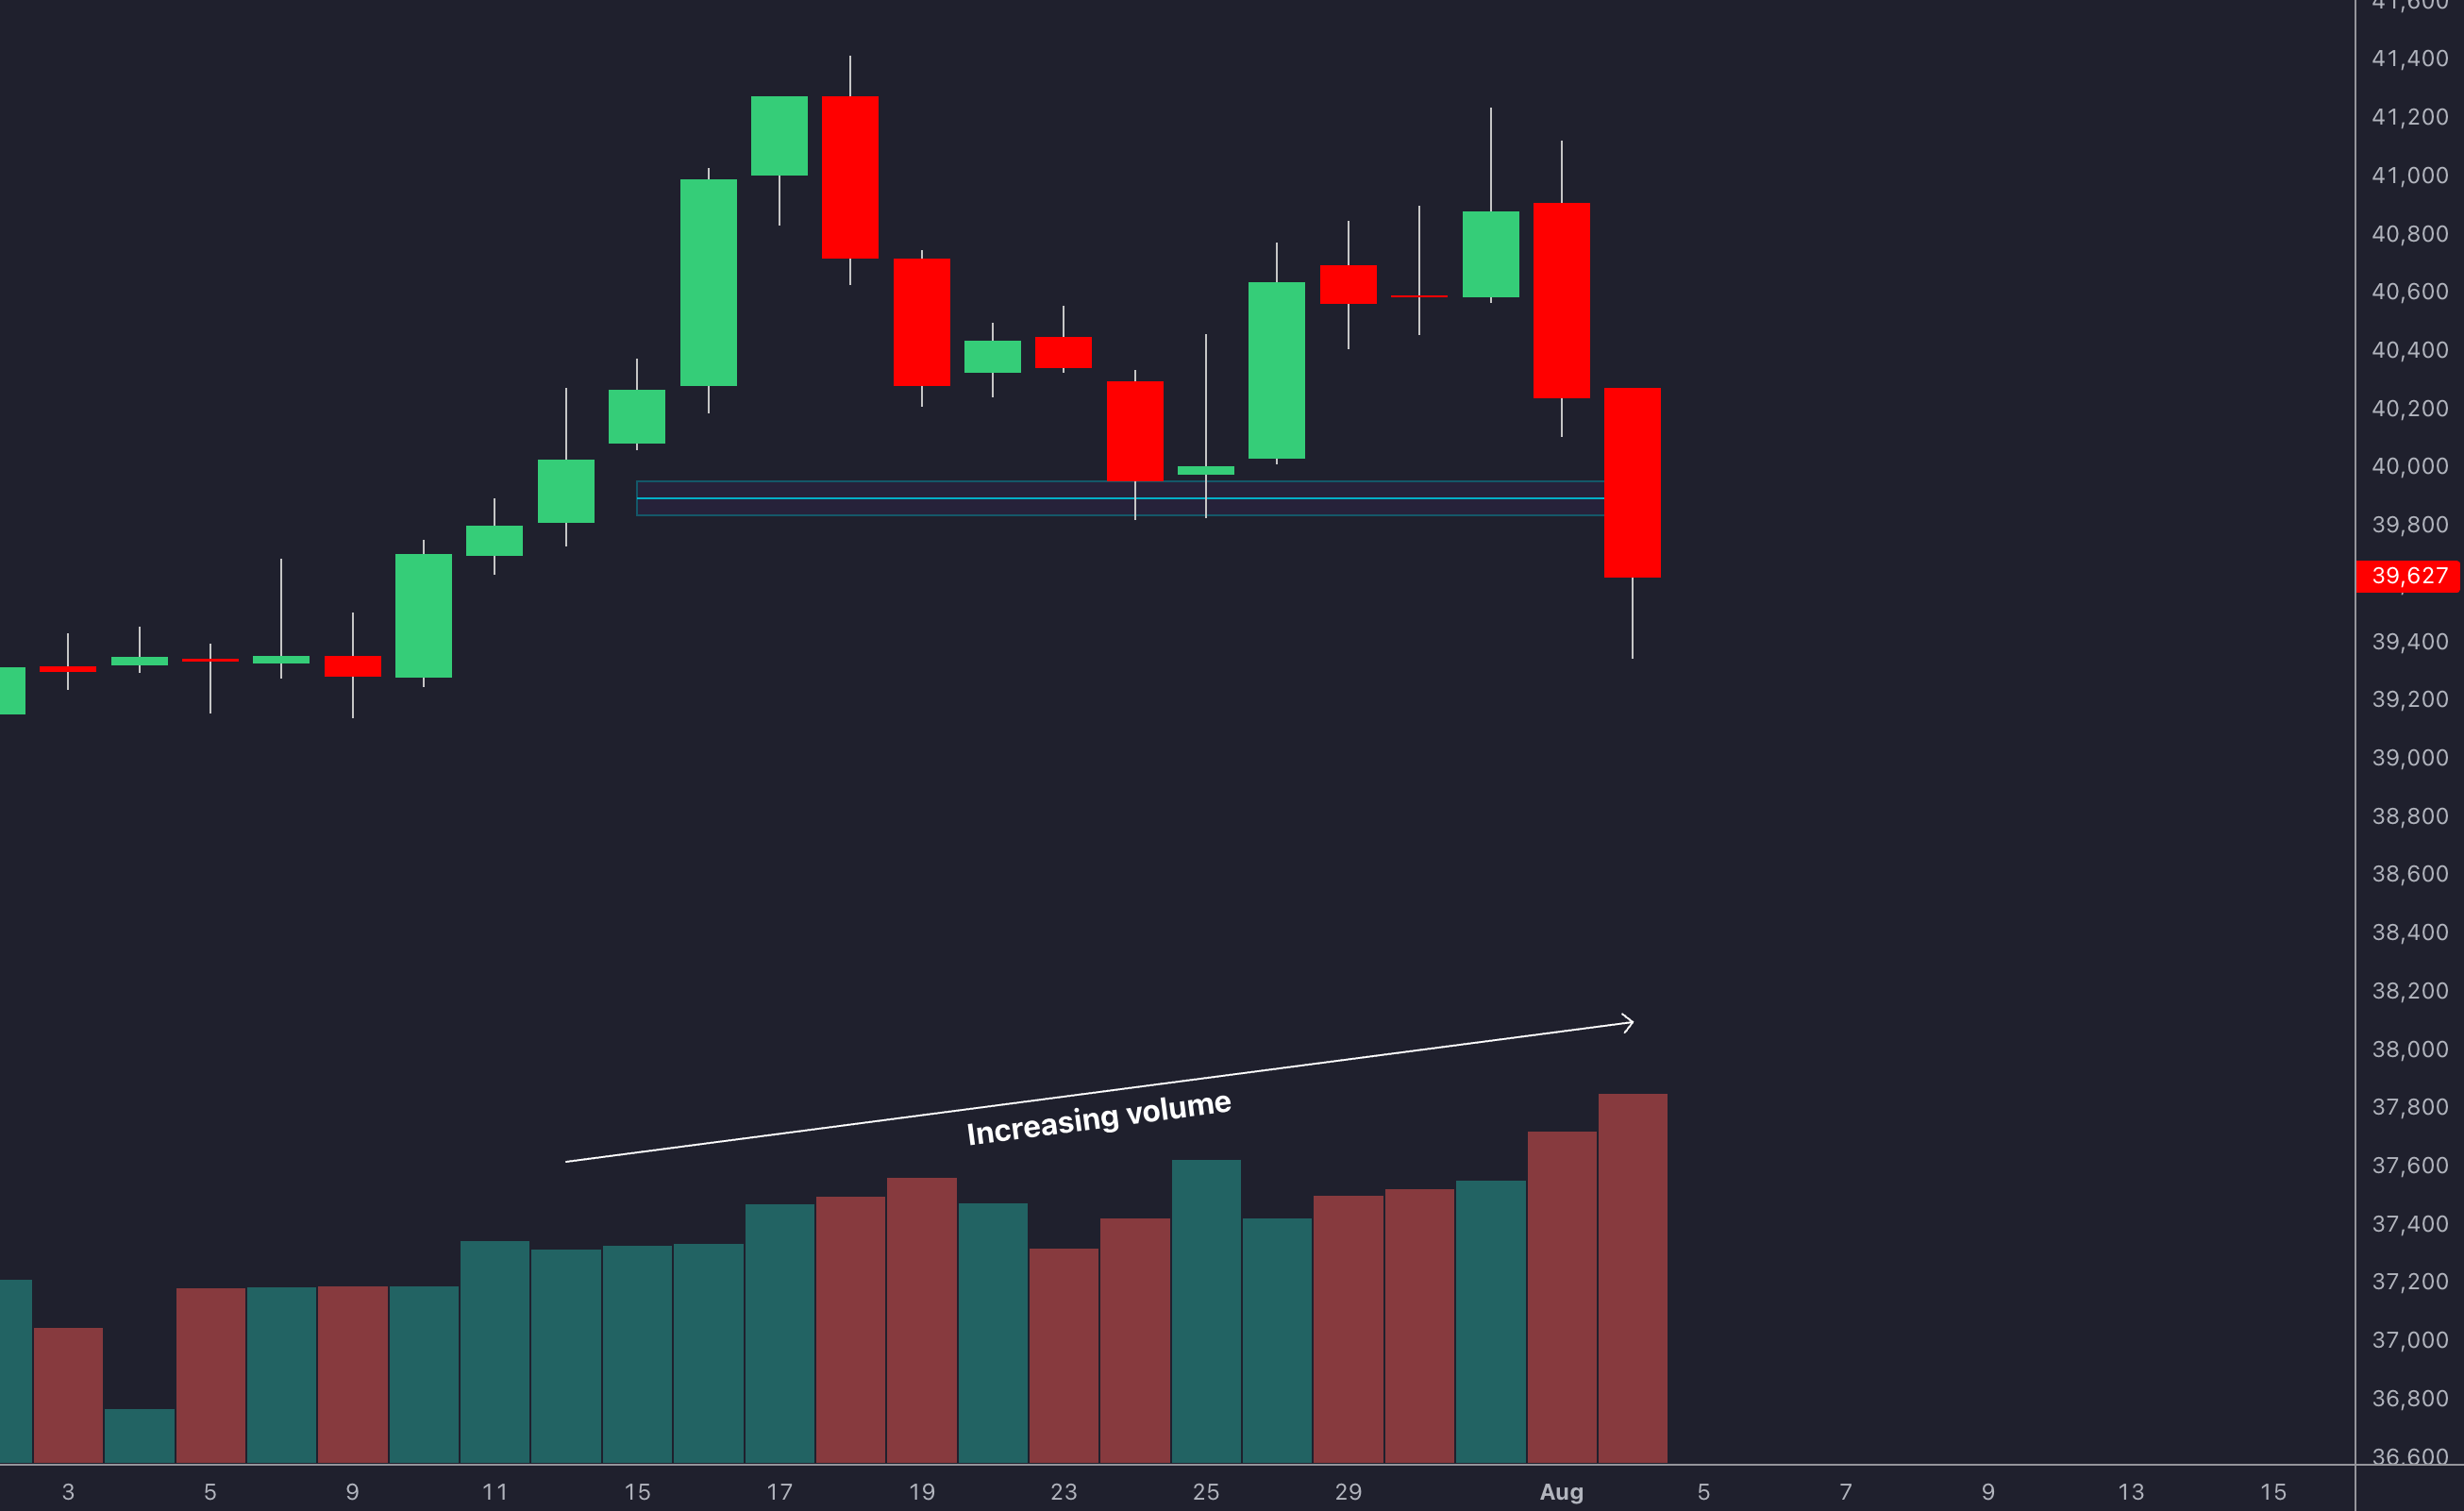
One of the most powerful uses of volume is to confirm breakouts. A breakout occurs when the price moves decisively above a resistance level or below a support level.
- A breakout on high volume is considered valid and suggests the price will continue in the direction of the breakout. It shows strong conviction from the market.
- A breakout on low volume is suspect and could be a "fakeout." It signals a lack of participation, and the price may quickly reverse back into its previous range.

3. Analyzing the Health of a Trend
Beyond single-day moves, you can use volume to assess the overall health of a sustained trend. A healthy trend has a natural rhythm of "impulsive" moves in the direction of the trend and "corrective" moves against it. Volume should reflect this rhythm.
Let's return to our first video, which has an excellent segment explaining this concept.
🛑 STOP Trading Until You Learn VOLUME ANALYSIS...
This segment from 'STOP Trading Until You Learn VOLUME ANALYSIS...' demonstrates how to analyze the health of an uptrend or downtrend by observing volume patterns during impulsive and corrective waves.
Please watch from 04:16 to 06:10. Focus on this key pattern: Healthy Uptrend: High/increasing volume on up moves, and low/decreasing volume on pullbacks. Healthy Downtrend: High/increasing volume on down moves, and low/decreasing volume on relief rallies.
This is a more nuanced application of volume analysis. If you are in an uptrend and you see a pullback on very low volume, it can give you the confidence to hold your position, as it suggests the selling is not aggressive. However, if the price starts to make new highs on progressively weaker volume, it's a warning sign that the trend might be exhausted.
Conclusion
You have now added a critical dimension to your technical analysis toolkit. While price-based indicators like MA, RSI, and MACD tell you about the trend and momentum, volume provides the context and confirmation. It helps you gauge the market's conviction and separate significant moves from mere market noise.
Key Takeaways:
- Volume Measures Conviction: High volume signifies high participation and strong conviction behind a price move. Low volume signifies the opposite.
- "Volume Equals Validity": A price trend is confirmed when volume moves in the same direction. A trend is questionable when volume diverges from the price action.
- Confirming Trends: In a healthy uptrend, volume should be higher on up days and lower on down days. In a healthy downtrend, volume should be higher on down days and lower on up days.
- Validating Breakouts: A breakout above resistance or below support is much more reliable if it occurs on high volume.
Preview of the Next Lesson:
So far, we have focused on objective data from the market: price and volume. However, investing is not done by robots, but by humans. Our next lesson, "Describe common cognitive biases that affect investors," will shift our focus inward. We will explore the psychological traps—like overconfidence, herd mentality, and loss aversion—that can lead even the most skilled analyst to make poor decisions. Understanding these biases is the first step to overcoming them.