Hello! Welcome back to our journey into financial analysis.
Introduction
In our previous lesson, we explored profitability ratios like net margin and Return on Equity (ROE), which measure how effectively a company generates profit. We saw that a company's ability to make a profit is a key indicator of its performance.
However, being profitable isn't the whole story. A company can be profitable on paper but still fail if it runs out of cash to pay its immediate bills, such as salaries and payments to suppliers. This brings us to the focus of today's lesson: liquidity.
This lesson will teach you how to calculate and interpret two key liquidity ratios: the current ratio and the quick ratio. These ratios help answer the critical question: "Can this company meet its short-term financial obligations?"
In your role as a TechOps Engineer, you understand that system health isn't just about long-term architecture; it's also about having enough real-time resources like memory and CPU to handle immediate loads. A system that runs out of memory will crash, no matter how well-designed it is. A company's liquidity is the financial equivalent of these real-time resources.
What is Liquidity?
Liquidity refers to a company's ability to meet its short-term obligations—those due within one year—using its short-term assets. These are assets that are expected to be converted into cash within a year. Strong liquidity is a sign of financial stability, while poor liquidity can be a major red flag for investors, indicating a risk of financial distress.
To start, let's watch a short video that introduces the concept of liquidity and why it's so important in financial analysis.
INTERPRETATION OF FINANCIAL STATEMENTS (ACCOUNTING RATIOS) - PART 1
This video from FOG Accountancy Tutorials provides a solid conceptual foundation for liquidity, explaining the relationship between current assets and current liabilities.
Please watch the segment from 28:32 to 30:37. It explains why a company's ability to cover its short-term debts is a fundamental aspect of its financial health.
Now that we understand the concept, let's learn how to measure it.
1. The Current Ratio
The current ratio is the most widely used metric for evaluating a company's short-term liquidity. It compares a company's total current assets to its total current liabilities. You can find both of these figures on the company's balance sheet.
The formula is:
- Current Assets typically include cash, accounts receivable (money owed by customers), and inventory.
- Current Liabilities typically include accounts payable (money owed to suppliers) and short-term debt.
The video below gives a clear, step-by-step guide to calculating and understanding the current ratio.
3 Liquidity Ratios You Should Know
This video from Accounting Stuff demonstrates how to find the necessary components on a balance sheet and calculate the current ratio.
Watch the section from 00:31 to 02:57. Pay attention to how current assets are organized by liquidity, from most liquid (cash) to least liquid (inventory).
Interpreting the Current Ratio
- A ratio greater than 1 suggests that the company has more current assets than liabilities, indicating it can likely cover its short-term obligations.
- A ratio less than 1 signals potential trouble, as it implies the company doesn't have enough liquid assets to cover its short-term debts.
- A very high ratio (e.g., above 3) isn't always positive. It could mean the company is inefficiently using its assets—for example, holding too much cash that could be reinvested for growth.
2. The Quick Ratio (Acid-Test Ratio)
The current ratio is useful, but it has a limitation: it treats all current assets equally. However, some assets, like inventory, can be difficult to sell quickly without a steep discount.
To address this, analysts use the quick ratio, also known as the acid-test ratio. It provides a more conservative or "stricter" measure of liquidity by excluding inventory from current assets.
The formula is:
This ratio tells you if a company can meet its short-term obligations without relying on the sale of its inventory.
Let's return to the same video to see how the quick ratio is calculated.
3 Liquidity Ratios You Should Know
The '3 Liquidity Ratios' video continues by explaining the quick ratio, highlighting why it's a more stringent test of liquidity.
Now watch from 03:02 to 04:10. Notice how removing inventory from the calculation changes the liquidity picture for the example company.
Interpreting the Quick Ratio
- A ratio greater than 1 is generally considered healthy. It means the company has enough easily convertible assets to cover its short-term liabilities.
- A ratio less than 1 indicates that the company depends on selling its inventory to pay its bills. This might be acceptable for a business with very fast-moving inventory (like a supermarket), but it's a risk factor for others.
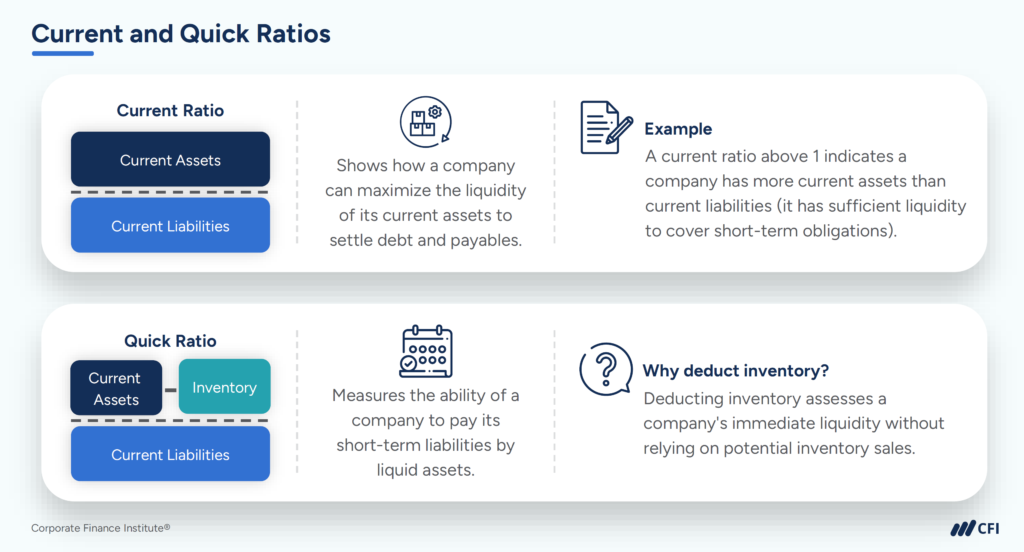
This image provides a great side-by-side summary of the two ratios.
Comparing the Ratios: The Role of Inventory
The real insight often comes from comparing the current and quick ratios. A significant difference between the two reveals how much the company relies on its inventory for liquidity.
Current Ratio vs Quick Ratio: Comparing Two Key Liquidity Ratios
This article from the Corporate Finance Institute (CFI) provides an excellent written explanation of how to interpret the current and quick ratios, both individually and together.
Please read the section titled 'How to Interpret the Current Ratio vs. Quick Ratio'. Focus on the sub-section 'Comparing Results Across Both Ratios' to understand what a wide gap between the two ratios signifies.
As the article explains, a large gap between the ratios means inventory makes up a large portion of the company's current assets. This isn't inherently bad, but it's a point for you as an investor to investigate. Is the inventory selling quickly, or is it at risk of becoming obsolete?
A Sri Lankan Context: Industry Benchmarks
A ratio is most useful when compared to a benchmark. This could be the company's own historical ratios or the average ratios of its industry peers. For your goal of investing in the Colombo Stock Exchange (CSE), it's helpful to see what these ratios look like for Sri Lankan companies.
The abstract of a research paper below provides some context. It studied manufacturing companies listed on the CSE.
[PDF] The Impact of Liquidity Ratios on Profitability - IRJAES
This research paper analyzed the financial data of manufacturing companies on the CSE. While academic in nature, its findings give us a real-world benchmark for liquidity ratios in Sri Lanka.
Please review 'TABLE 2. Descriptive statistics for variable' and the paragraph immediately following it. You don't need to read the whole paper. Focus on the 'Mean' values for CR (Current Ratio) and QR (Quick Ratio) and the authors' interpretation of those numbers.
From the paper, we see that for the manufacturing companies studied between 2012-2016, the average:
- Current Ratio was 1.81
- Quick Ratio was 1.00
The authors note that the average quick ratio of 1.00 suggests these companies, on average, had just enough liquid assets to cover short-term obligations without selling inventory. This gives you a practical reference point when you analyze a manufacturing company on the CSE.
Calculation Example: A CSE-Listed Company
Let's apply what you've learned to the same example company from our previous lesson, ABC Company Limited, using the data from the CSE guide (resource_id: 61a5f). From its 2012 balance sheet (page 25):
- Current Assets: 1,222
- Current Liabilities: 1,155
- Inventories: 620
Now, let's calculate the liquidity ratios:
-
Current Ratio:
The ratio is just above 1, suggesting the company can barely cover its short-term liabilities with its current assets. This is lower than the 1.81 average we saw for manufacturing firms.
-
Quick Ratio:
The ratio is well below 1, meaning the company is heavily reliant on selling its inventory to meet its obligations. This 0.52 is also significantly lower than the 1.00 industry average from the study.
The wide gap between the current ratio (1.06) and the quick ratio (0.52) confirms this heavy dependence on inventory, which constitutes over half of the company's current assets (620 out of 1,222). This would be a key area to investigate further as an investor.
Conclusion
You've now added two powerful tools to your analytical toolkit. While profitability ratios tell you if a company is making money, liquidity ratios tell you if it can survive in the short term.
Key Takeaways:
- Liquidity is a company's ability to pay its short-term bills. It's crucial for financial stability.
- The Current Ratio provides a broad measure of liquidity by comparing all current assets to current liabilities.
- The Quick Ratio offers a stricter test by excluding less-liquid inventory.
- Comparing the two ratios reveals the company's dependence on selling inventory.
- The interpretation of these ratios is not universal; it requires context, such as industry averages and historical trends.
Preview of the Next Lesson:
We've assessed short-term risk with liquidity ratios. Next, we will turn our attention to long-term stability by examining leverage ratios. These ratios, like the Debt-to-Equity ratio, measure how much a company relies on debt to finance its operations and can reveal long-term financial risk.