Hello! Welcome back to our course on investing in the stock market.
Introduction
In our last lesson, we connected the dots between the income statement, balance sheet, and cash flow statement, understanding them as an integrated system. We saw how a figure like Net Income is a crucial link, flowing from the income statement to both the balance sheet and the cash flow statement.
Today, we move from understanding the structure of these statements to using them for analysis. This lesson introduces profitability ratios, which are essential tools for measuring a company's performance. By the end of this session, you will be able to calculate and interpret three of the most important profitability ratios: gross margin, net margin, and return on equity (ROE).
Think of these ratios as key performance indicators (KPIs) for a business. In your work as a TechOps Engineer, you monitor system metrics like uptime, response time, and error rates to gauge health and efficiency. Profitability ratios serve a similar purpose for a company's financial health, telling us how efficiently it generates profits from its sales and its capital.
What are Profitability Ratios?
Financial ratios are calculations that relate two or more financial figures taken from a company's financial statements. They provide a standardized way to compare companies of different sizes and to track a company's performance over time.
Profitability ratios, as the name suggests, measure a company's ability to generate earnings relative to its revenue, operating costs, balance sheet assets, or shareholders' equity.
To get a clear overview, let's start with a video that introduces the main categories of financial ratios and explains the specific purpose of profitability ratios.
FINANCIAL RATIOS: How to Analyze Financial Statements
This video from Accounting Stuff provides an excellent introduction to financial ratio analysis and categorizes them into logical groups. Pay close attention to the distinction made between 'Margin Ratios' and 'Return Ratios'.
Please watch the first 3 minutes and 6 seconds of the video (00:00 - 03:06). This will set the stage by explaining what financial ratios are and introducing the two main types of profitability ratios we'll be discussing today.
As the video explained, we can broadly group the profitability ratios we're covering today into two types:
- Margin Ratios: These measure how well a company converts revenue into profit.
- Return Ratios: These measure how effectively a company generates profit from the money invested in it.
Let's look at each of these in detail.
Margin Ratios: Gauging Profit on Sales
Margin ratios tell you what percentage of sales has turned into profit. We will focus on two key margins: Gross Margin and Net Margin.
1. Gross Profit Margin
The Gross Profit Margin looks at the most basic level of profitability. It tells you how much profit a company makes from selling its products or services after subtracting the direct costs of producing them (known as the Cost of Goods Sold or COGS).
The formula is:
- Interpretation: A high gross margin indicates that a company is efficient at producing its goods or has strong pricing power. For example, a gross margin of 40% means that for every 100 LKR in sales, the company has 40 LKR left over to cover its other operating expenses, interest, taxes, and to generate a net profit.
The video you just watched has a short segment that explains this clearly.
FINANCIAL RATIOS: How to Analyze Financial Statements
Let's revisit the 'FINANCIAL RATIOS' video to see how Gross Profit Margin is calculated.
Please watch the segment from 03:35 to 04:11. It quickly explains where to find the numbers and what the ratio tells us.
2. Net Profit Margin
The Net Profit Margin is often called the "bottom line" margin. It measures what percentage of revenue is left as profit after all expenses—including operating costs, interest, and taxes—have been paid.
The formula is:
- Interpretation: This is a comprehensive measure of a company's profitability. A net margin of 15% means the company keeps 15 LKR in profit for every 100 LKR of revenue it generates. It reflects the efficiency of the entire business operation, from production to management and financing.
The following video provides a clear, worked example of calculating the Net Profit Margin.
6 Profitability Ratios You Should Know
This video from Accounting Stuff, '6 Profitability Ratios You Should Know,' gives a practical example of calculating the Net Profit Margin.
Watch the segment from 05:21 to 06:37. Notice how it uses the top line (Revenue) and the bottom line (Net Profit) of the income statement.
Return Ratios: Gauging Profit on Investment
While margin ratios focus on sales, return ratios assess how well a company is using its capital to generate profits. This is crucial for you as a potential shareholder.
3. Return on Equity (ROE)
Return on Equity is one of the most important ratios for an investor. It measures how much profit a company generates for each rupee of shareholders' equity. In essence, it shows how effectively management is using investors' money.
The formula requires figures from both the income statement and the balance sheet:
- Interpretation: An ROE of 20% means that the company generated 20 cents of profit for every 1 LKR of equity capital. A consistently high ROE is often a sign of a high-quality company with a sustainable competitive advantage.
Let's see this calculated in the same video.
6 Profitability Ratios You Should Know
The video on '6 Profitability Ratios' also has an excellent segment on Return on Equity.
Please watch from 01:59 to 03:13. Pay attention to how the numbers are pulled from two different financial statements (Income Statement and Balance Sheet), reinforcing what we learned in the last lesson.
A crucial caution on ROE: A very high ROE is not always a good sign. A company can artificially inflate its ROE by taking on a lot of debt. More debt reduces the amount of shareholder equity in the denominator of the formula, which can push the ROE figure higher even if profits aren't growing. This increases financial risk.
This is where a framework called DuPont Analysis is useful. It breaks down ROE into three components:
- Net Profit Margin (Profitability)
- Asset Turnover (Asset Use Efficiency)
- Equity Multiplier (Financial Leverage)
This chart illustrates the concept.
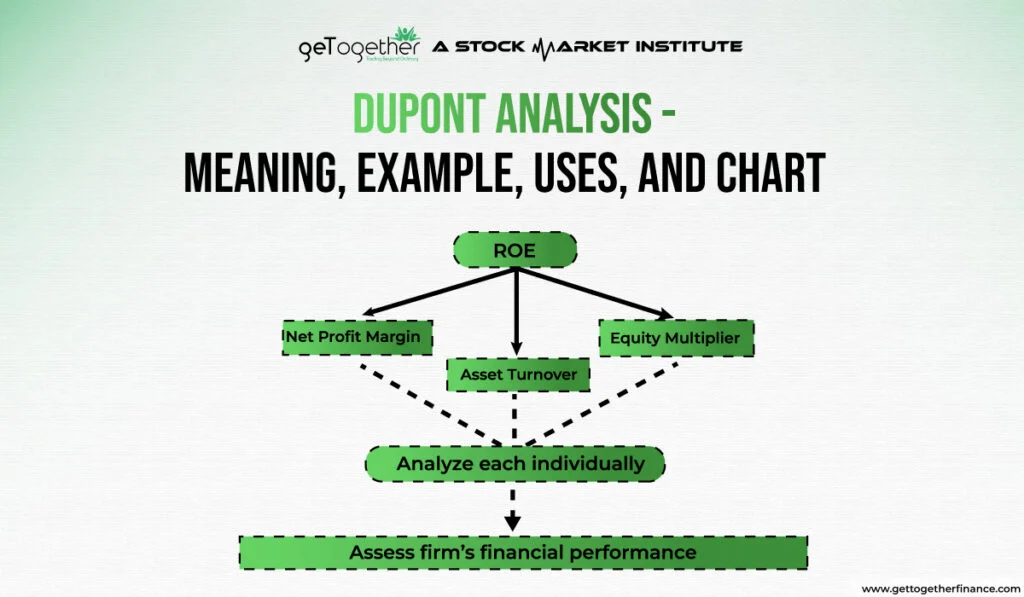
For someone with your IT background, you can think of this as decomposing a complex system into its core functions to understand its overall performance. We will cover the other ratios (like Asset Turnover and Leverage) in upcoming lessons, but it's important to see now that ROE is driven by more than just profit.
Bringing It All Together: A Sri Lankan Example
To solidify your understanding, let's turn to a guide published by the Colombo Stock Exchange (CSE) that contains example financial statements.
[PDF] FINANCIAL STATEMENTS - cse.lk
This guide from the CSE, which we have used before, provides a good summary of ratio analysis with examples relevant to Sri Lankan reporting standards.
Please review pages 24-31 of the PDF. Start by looking at the example 'Income Statement' (page 24) and 'Statement of Financial Position' (page 25). Then, skim through the 'PROFITABILITY RATIOS' section starting on page 29. Focus specifically on how the 'Net Profit Ratio' and 'Return on Equity (ROE)' are calculated on pages 29 and 31 using the example data.
Using the data for ABC Company Limited (2012) from that document:
- Net Profit After Tax: 112 (from Income Statement, page 24)
- Sales Revenue: 3,571 (from Income Statement, page 24)
- Total Equity: 617 (from Balance Sheet, page 25)
Let's calculate the ratios:
-
Net Profit Margin:
This means ABC Company kept about 3.14 LKR as profit for every 100 LKR of sales. -
Return on Equity (ROE):
This means the company generated a return of 18.15 LKR for every 100 LKR of capital invested by its shareholders.
Is 18.15% a good ROE? On its own, the number has limited meaning. The real power of ratio analysis comes from comparison—comparing this figure to the company's past performance and to the ROE of its competitors in the same industry. We will explore this comparative analysis in a future lesson.
Conclusion
Congratulations on completing your first dive into financial ratio analysis! You are now equipped with a fundamental toolkit for assessing a company's profitability.
Key Takeaways:
- Profitability Ratios measure a company's efficiency in generating profits from its sales and capital.
- Gross Profit Margin reflects the profitability of a company's core business activities before overheads.
- Net Profit Margin shows the "bottom line" profitability after all expenses are accounted for.
- Return on Equity (ROE) is a key metric for shareholders, showing the return generated on their investment.
- The interpretation of a ratio is crucial; a single number is not enough. High ROE, for instance, should be examined carefully to understand if it's driven by profit or by risky debt.
Preview of the Next Lesson:
Now that we have looked at profitability, our next lesson will address another critical question: can the company pay its short-term bills? We will cover liquidity ratios, such as the Current Ratio and Quick Ratio, which measure a company's financial stability and its ability to meet immediate obligations.