Hello! Welcome to the fifth lesson in our module on analyzing company performance.
Introduction
In our previous lessons, we've systematically built a toolkit of financial ratios, learning how to calculate and interpret metrics for profitability, liquidity, leverage, and efficiency. We now have the tools to measure different aspects of a company's financial health. However, a ratio like a "Current Ratio of 1.5" or an "Asset Turnover of 1.2" is just a number. It lacks meaning without context.
This lesson is all about providing that context. Today, we will focus on the core analytical skill of comparison, which turns raw data into actionable insight. This process is similar to your work as a TechOps Engineer: a single data point like 'CPU usage at 50%' isn't very informative until you compare it to its historical trend (was it 20% yesterday?) or to a benchmark (are similar servers running at 30%?).
This lesson directly addresses the learning outcome: Compare a company's financial ratios against its historical performance and industry peers. By the end of our session, you'll understand the two primary methods for comparison that are fundamental to stock analysis.
1. The Two Pillars of Ratio Comparison
Financial ratio analysis stands on two main pillars of comparison: looking at the company's own history and looking at its competitors.
To get a clear and concise introduction to these two methods, please watch the beginning of the following video.
Financial Ratio Analysis【Dr. Deric】
This video from Dr. Deric introduces the two essential types of ratio comparison: Trend Analysis and Cross-Sectional Analysis.
Watch the first 2 minutes and 19 seconds of the video. Pay close attention to the definitions of 'Trend analysis' (or time-series analysis) and 'cross-sectional analysis.'
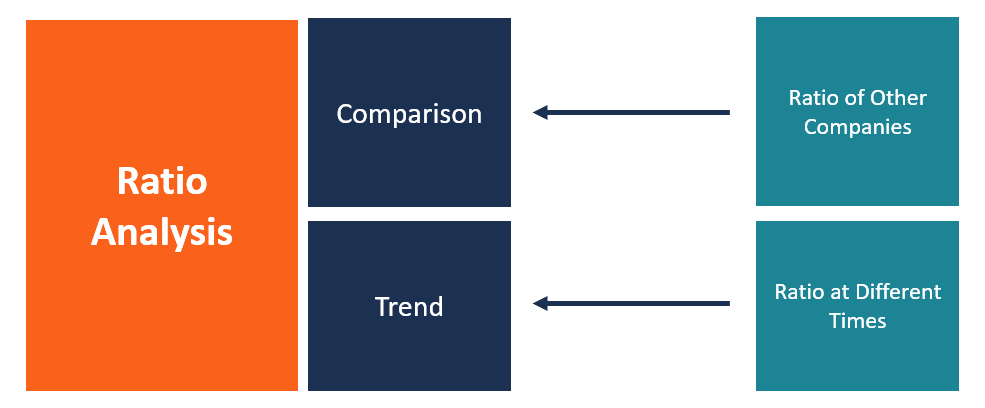
As the video explained, the two key methods are:
- Trend Analysis (Historical Comparison): Evaluating a single company's performance over several time periods (e.g., the last 3-5 years).
- Cross-Sectional Analysis (Peer Comparison): Comparing a company's performance against other companies in the same industry at the same point in time.
This can be visualized clearly:
Let's explore each of these methods in more detail.
2. Trend Analysis: Comparing a Company to Its Past
Trend analysis involves calculating and plotting a company's financial ratios over multiple periods (typically 3-5 years) to identify patterns. Are things getting better, worse, or staying the same?
What to look for:
- Improving Trends: A company might show increasing net profit margins, a rising asset turnover ratio, or a decreasing debt-to-equity ratio. This signals positive momentum.
- Deteriorating Trends: You might see declining liquidity ratios, falling return on equity, or slowing inventory turnover. These are warning signs that require investigation.
- Stability: Consistent performance in certain ratios, like the dividend yield for a mature company, can indicate stability and predictability.
The following image shows a practical example of how you might lay out data for trend analysis in a spreadsheet.

Your experience with data tools like Excel, Tableau, or Power BI is directly applicable here. You can pull financial data from annual reports, put it into a spreadsheet, calculate the ratios for each year, and even create charts to visualize these trends.
3. Cross-Sectional Analysis: Comparing a Company to Its Peers
While trend analysis tells you about a company's trajectory, cross-sectional analysis tells you how it stacks up against the competition. This is crucial for understanding its position in the market.
To perform a meaningful comparison, you must compare "apples to apples." Let's watch a clip that explains why.
10 Financial Ratios Every Investor Must Know
In this video, Joseph Hogue explains the importance of comparing companies within the same industry and provides clear examples.
Watch from 02:01 to 02:47. Focus on the explanation of why comparing ratios of a tech company like Microsoft to a consumer goods company like Procter & Gamble is not useful.
As the video highlights, business models, capital needs, and margin structures vary dramatically between industries. A bank's debt-to-equity ratio will naturally be much higher than a software company's. Therefore, comparing them is meaningless.
There are two main ways to perform cross-sectional analysis:
- Industry Benchmarking: Comparing a company's ratios to the average for its entire industry. This gives you a broad sense of whether the company is performing above, below, or in line with the market.
- Peer Group Benchmarking: Comparing a company to a small, carefully selected group of its most direct competitors. This provides a more detailed and often more relevant insight.
The following reading explains these two approaches in more detail and discusses the critical process of selecting the right peers.
Financial Benchmarking: Comparing Company Performance | CFI
This article from the Corporate Finance Institute (CFI) provides an excellent breakdown of financial benchmarking.
Please read the following sections of the article: 'Financial Benchmarking: Industry and Peer Analyses': Understand the definitions of Industry and Peer benchmarking. 'Industry Benchmarking': Note the benefits and limitations of comparing to the entire industry. 'Peer Group Benchmarking': Understand why this is often a more granular and useful approach. 'The Critical Importance of Peer Selection in Benchmarking': This is a key section. Grasp why choosing the right comparables is so important. 'Comprehensive Peer Selection Criteria': Look at the table showing the business and financial characteristics you should consider when selecting peers.
This guide from the Colombo Stock Exchange also reinforces this idea, specifically in the context of Earnings Per Share (EPS).
[PDF] STOCK SELECTION AND DECISION MAKING - cse.lk
Let's revisit the 'Stock Selection and Decision Making' guide from the CSE. It provides a localized perspective on using ratio comparisons.
Please find the section '14.0 EARNINGS PER SHARE (EPS)' on page 20. Read the paragraph at the top of page 21 that begins 'Thus earnings per share is Rs. 2.00'. Notice how it explicitly recommends comparing EPS across a few years (trend analysis) and with the industry average (cross-sectional analysis).
4. A Practical Framework for Comparison
So, how do you put this all together when analyzing a stock on the CSE?
-
Identify the Company and its Peers:
- Choose the company you want to analyze (e.g., John Keells Holdings PLC).
- Identify its industry sector (e.g., Diversified Holdings).
- Find 2-3 of its main competitors listed on the CSE (e.g., Hayleys PLC, Aitken Spence PLC).
-
Gather the Data:
- Download the annual reports for your target company and its peers for the last 3-5 years. You can find these on the CSE website or the companies' own investor relations pages.
- Look for sources of industry average data. Some brokerage reports provide this, and we've previously referenced a research paper that compiled some CSE industry ratios.
-
Calculate and Tabulate:
- In a spreadsheet, create a table to calculate the key ratios (e.g., Net Margin, ROE, Current Ratio, Debt-to-Equity, Asset Turnover) for all companies for all years.
-
Analyze and Interpret:
- Row-by-Row (Trend): Look at the rows for your target company. How have its ratios changed over the past 5 years? Are there positive or negative trends?
- Column-by-Column (Peer): Look at the columns for the most recent year. How do your company's ratios compare to its peers? Is it a leader or a laggard? Where are its strengths and weaknesses?
- Synthesize: Combine your observations. For example: "Company A's Return on Equity has improved from 10% to 15% over five years (positive trend) and is now higher than the peer average of 12% (strong competitive position)."
Conclusion
You have now learned the crucial art of putting financial ratios into context. Without comparison, a ratio is just a number. With comparison, it becomes a powerful tool for analysis.
Key Takeaways:
- Analysis requires comparison. There are two main methods: Trend Analysis and Cross-Sectional (Peer) Analysis.
- Trend Analysis compares a company's ratios to its own historical performance, revealing its trajectory (improving, deteriorating, or stable).
- Peer Analysis compares a company's ratios to its competitors or industry averages, revealing its relative performance and market position.
- It is essential to only compare companies within the same industry due to different business models and financial structures.
- A good analysis combines both methods to build a comprehensive view of a company's health.
Preview of the Next Lesson:
Now that you know how to perform these comparisons, the next logical step is to use them to spot potential problems. In our next lesson, we will cover how to "Identify potential red flags in financial statements using ratio analysis." We will learn to use the comparative insights gained today to pinpoint specific areas of concern that warrant deeper investigation.