Welcome back! In our previous lesson, we explored the Income Statement, which tells us about a company's profitability over a period of time. Now, we move to the second of the "big three" financial statements.
Introduction
This lesson focuses on the Balance Sheet, also known as the Statement of Financial Position. While the Income Statement is like a video showing a company's performance over a quarter or a year, the Balance Sheet is a single photograph—a snapshot of the company's financial health at a specific point in time.
By the end of this lesson, you will be able to read and interpret the key components of a balance sheet: assets, liabilities, and equity.
From your perspective as a TechOps Engineer, if the Income Statement is like a performance log tracking throughput and errors over time, the Balance Sheet is akin to a system configuration snapshot. It tells you exactly what resources (assets like servers and cash) the system has at a precise moment, and how those resources are funded—either through debt (liabilities) or owner funding (equity).
Part 1: The Fundamental Accounting Equation
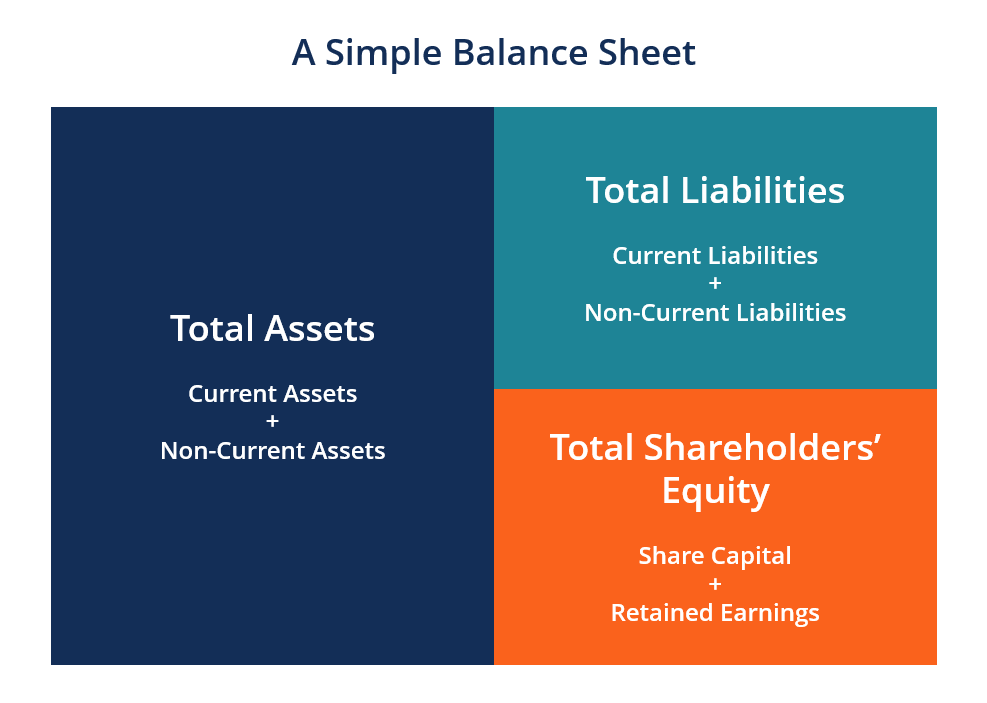
The Balance Sheet gets its name because it is built on a fundamental equation that must always, without exception, balance. This equation shows that what a company owns is funded by what it owes to others (creditors) and what it owes to its owners.
The equation is:
- Assets: Economic resources owned by the company (e.g., cash, buildings, inventory).
- Liabilities: The company's financial obligations or debts to outside parties (e.g., loans, money owed to suppliers).
- Equity: The residual value of the assets after deducting liabilities. It represents the ownership interest of the shareholders.
To get a clear introduction to this concept, let's watch a short video.
The BALANCE SHEET for BEGINNERS (Full Example)
This video from 'Accounting Stuff' provides a simple and effective explanation of the balance sheet and the core accounting equation.
Please watch the segment from 00:13 to 01:17. Focus on how the video defines the balance sheet as a 'snapshot' and introduces the fundamental equation.
This simple but powerful equation is the bedrock of the entire statement. All the complexity of a balance sheet is just a detailed breakdown of these three categories.
Part 2: Breaking Down the Components
Now, let's dive into what makes up each part of the equation. We'll classify assets and liabilities into two main types: current (short-term) and non-current (long-term). Generally, "current" refers to items expected to be converted to cash or paid off within one year.
To get a quick overview of these categories, let's return to the "Accounting Stuff" video.
The BALANCE SHEET for BEGINNERS (Full Example)
The next part of the video breaks down Assets, Liabilities, and Equity into their current and non-current sub-categories.
Watch the clip from 01:17 to 02:12. Pay attention to the examples given for each category, such as receivables, property, and retained earnings.
With that overview in mind, let's explore each component in more detail with a practical walkthrough.
How To Analyze a Balance Sheet
This video by Daniel Pronk provides an excellent, real-world demonstration of how to analyze a balance sheet using public company data. It gives clear definitions for each line item.
Please watch the video from 01:44 to 10:14. The video will cover: Assets (01:44 - 06:33): Focus on the difference between current assets (cash, receivables, inventory) and non-current assets (Property, Plant & Equipment, Goodwill). Liabilities (06:33 - 09:20): Note the distinction between current liabilities (debt due soon, accounts payable) and non-current liabilities (long-term debt). Stockholders' Equity (09:20 - 10:14): Understand how equity is the final balancing figure, representing the net worth of the company to its owners. Notice the mention of 'Retained Earnings', which is the link back to the Income Statement we studied.
The video did a great job of explaining these terms with a live example. To connect this directly to your goal of investing in Sri Lanka, let's read the definitions provided by the Colombo Stock Exchange (CSE) itself.
Understanding Financial Statements (CSE)
This guide from the CSE provides the official definitions and structure for financial statements in Sri Lanka. This will familiarize you with the exact format and terminology used by the companies you will be analyzing.
Please read pages 8, 9, and 10 of the PDF. Focus on the sections titled: ASSETS (page 8): Read the definitions for Non-Current and Current Assets. EQUITY AND LIABILITIES (page 9): Read the sections on Equity and Stated Capital. NON-CURRENT LIABILITIES and CURRENT LIABILITIES (pages 9-10): Read the definitions for these liability types.
Part 3: Reading a Real Balance Sheet
You now have a solid understanding of the theory. Let's apply it by looking at a real-world, consolidated balance sheet from a well-known company.

Let's interpret this statement together.
-
Find the Assets:
- Look for "Current assets". You'll see familiar lines like "Cash and cash equivalents," "Inventories," and "Accounts receivable, net." For 2014, the total current assets were $33,446 million.
- Below that, you see non-current assets like "Property, plant and equipment, net" and "Trademarks."
- The final line in this section, "TOTAL ASSETS," was $92,023 million in 2014.
-
Find the Liabilities:
- Look for "Current liabilities." This includes "Accounts payable" and "Loans and notes payable" (short-term debt). Total current liabilities for 2014 were $30,517 million.
- Below this, you find "Long-term debt" and other non-current liabilities.
- The "TOTAL LIABILITIES" for 2014 were $60,544 million.
-
Find the Equity:
- The section is titled "EQUITY." It includes "Common stock" and, importantly, "Reinvested earnings" (another name for Retained Earnings).
- The "TOTAL EQUITY" for 2014 was $31,479 million.
-
Check if it Balances:
Now, let's verify the accounting equation for 2014:This exactly matches the "TOTAL ASSETS" of $92,023 million. The balance sheet balances!
Notice that the statement shows data for multiple years. This allows you to perform trend analysis. For instance, you can see if the company's assets are growing, if its debt is increasing, or if its equity is building up over time. This is a powerful way to assess the direction a company is heading.
Conclusion
Great job! You have now mastered the structure and components of the Balance Sheet. This statement is crucial for assessing a company's financial stability and structure at a glance.
Key Takeaways:
- The Balance Sheet is a snapshot in time of a company's financial position.
- It is governed by the fundamental accounting equation: Assets = Liabilities + Equity.
- Assets are what a company owns, categorized as Current (short-term) and Non-Current (long-term).
- Liabilities are what a company owes to others, also categorized as Current and Non-Current.
- Equity is the owners' stake in the company, calculated as Assets minus Liabilities. It includes capital from owners and retained earnings from past profits.
Preview of the Next Lesson:
We've covered the Income Statement (profit over time) and the Balance Sheet (position at a point in time). However, profit on paper doesn't always equal cash in the bank. In our next lesson, we will tackle the Cash Flow Statement, which tracks the actual movement of cash from operating, investing, and financing activities. It's the final piece of the puzzle that links the Income Statement and the Balance Sheet together.