Welcome back. In our previous lesson, we established that for modeling recurrent events like the cycle of desire, Renewal Theory offers a more flexible framework than simple Markov models because it doesn't assume a constant "hazard rate." Instead, it allows the time between events to follow more realistic probability distributions.
Today, we will focus on the simplest and most fundamental renewal model: the Poisson process. Our goal is to test the goodness-of-fit of a Poisson process for the arrival of 'peak photogenic moments' during a shoot, and analyze the implications if arrivals are non-Poisson. You will learn a robust statistical procedure to validate whether a stream of events adheres to the Poisson assumption and, more importantly, what to conclude when it doesn't. Given your background as a statistician, you'll find the hypothesis testing framework familiar; our focus will be on the specific techniques for stochastic processes and their practical interpretation.
1. From Constant Rates to Time-Varying Intensity
Let's begin by quickly recapping the core relationship between the Exponential and Poisson distributions. A process of events is a (homogeneous) Poisson process if the waiting times between consecutive events are independent and exponentially distributed. This means the number of events occurring in any fixed time interval follows a Poisson distribution.
The Connection Between the Exponential Distribution and the Poisson Process
This video from Steve Brunton provides an excellent intuitive link between the two distributions.
Watch the segment from the beginning to the main explanation. Focus on how he visualizes a string of random events on a timeline. The key idea is that the waiting times between events, W_j, are exponentially distributed, while the number of events in a given interval of time, t, is Poisson distributed.
The core assumption of a homogeneous Poisson process is that the event rate, , is constant. For our boudoir photoshoot, this would mean "peak photogenic moments" are just as likely to occur at the beginning of the shoot as they are in the middle or at the end. This is a strong and often unrealistic assumption. A model's energy, creativity, and comfort with the photographer will naturally vary over time.
A more realistic model is the Nonhomogeneous Poisson Process (NHPP), or nonstationary Poisson process. Here, the constant rate is replaced by a time-varying intensity function, .
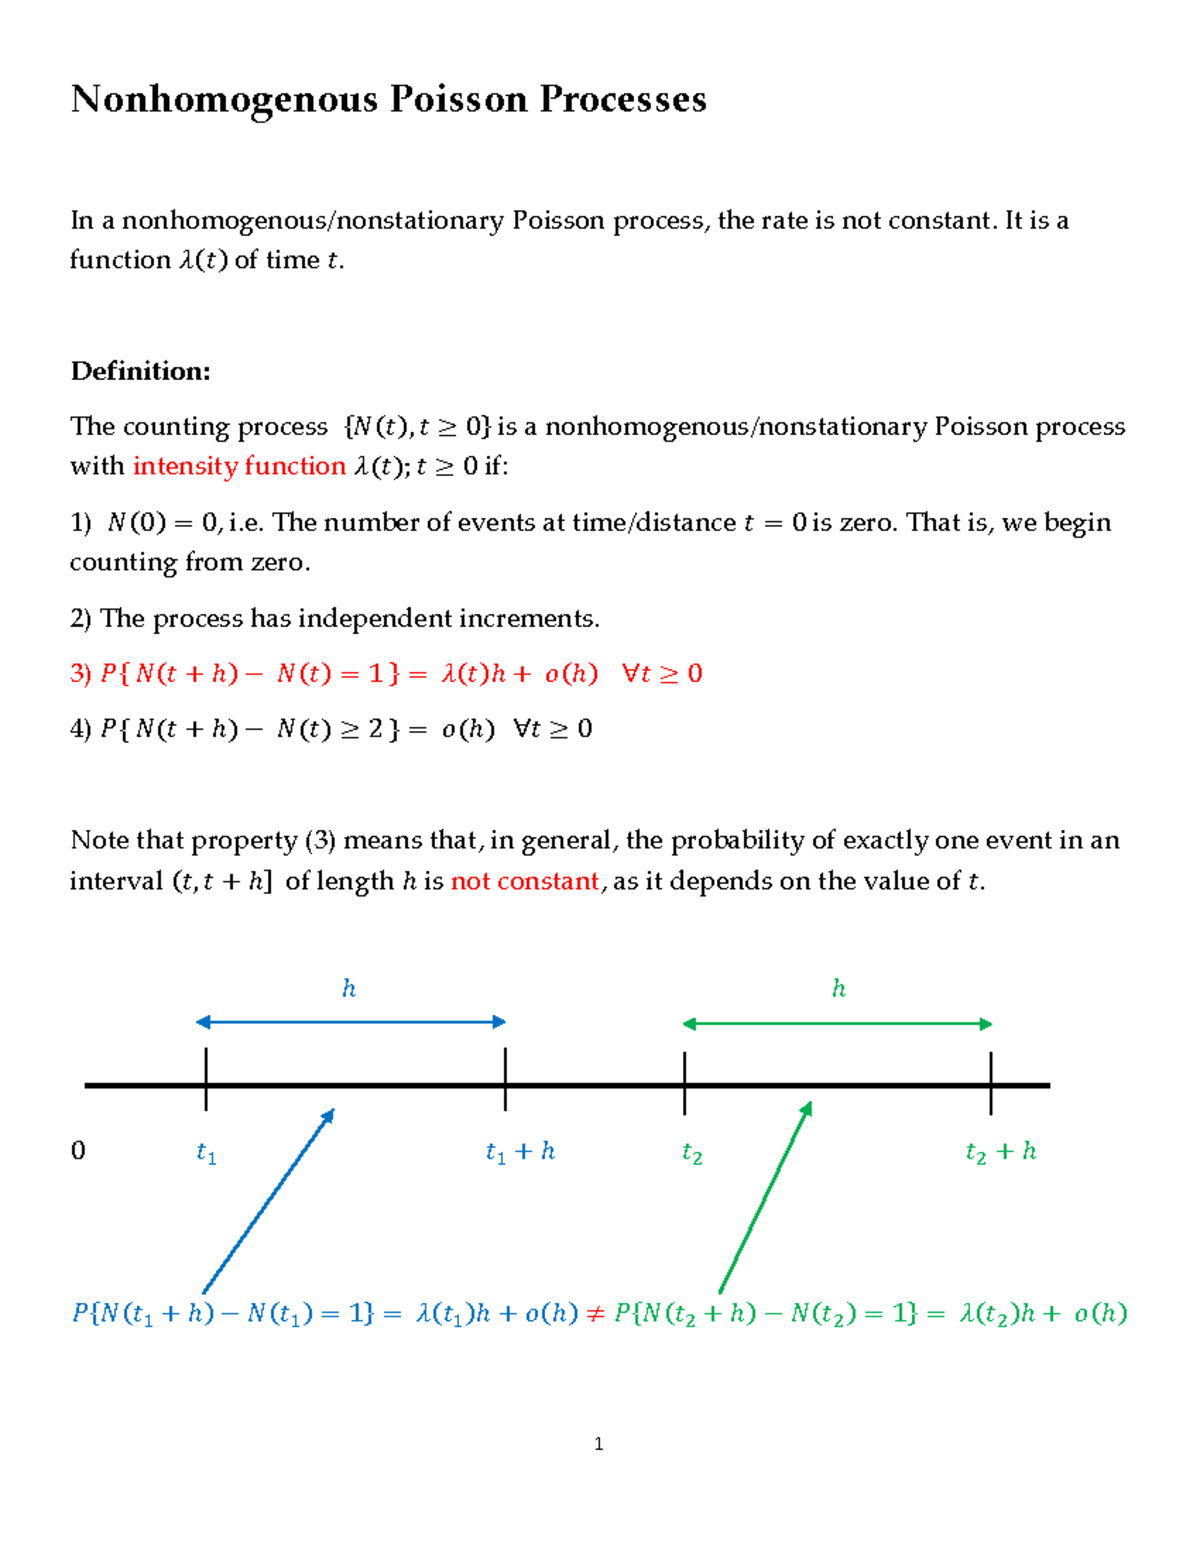
The NHPP elegantly captures the idea that the likelihood of a "peak moment" can rise as the model warms up, peak during a period of high energy, and then decline due to fatigue. Our central question is: given a set of timestamps for these peak moments, can we validate that they follow an NHPP?
2. A Strategy for Goodness-of-Fit Testing
To test if our data fits an NHPP, we need a method to handle the time-varying rate . A powerful and practical approach is to approximate the continuous intensity function as being piecewise-constant (PC). We can break the total photoshoot duration (e.g., 2 hours) into smaller subintervals (e.g., 15-minute blocks) and assume the rate is constant within each block, though it can differ between blocks.
This simplifies the problem: instead of testing against a complex , we test if the events within each subinterval follow a simple, homogeneous Poisson process. But how do we perform this test? This is where a clever transformation comes into play.
A foundational paper by Kim and Whitt, "Are Call Center and Hospital Arrivals Well Modeled by NHPPs?", outlines a robust methodology. While the paper is mathematically dense, its core ideas are highly practical.
[PDF] Are Call Center and Hospital Arrivals Well Modeled by ...
This paper provides the statistical foundation for our testing procedure. We'll focus on the core concept that allows us to test the Poisson hypothesis.
Please read the subsection "Exploiting the Conditional Uniform Property." The key takeaway is the Conditional Uniform (CU) property, which states that for a Poisson process, if you know n events happened in an interval, their scaled arrival times behave like ordered uniform random variables. This property allows us to transform our arrival data into a form that we can easily test using a standard statistical test like the Kolmogorov-Smirnov (KS) test.
The CU property is powerful, but a KS test applied directly to these transformed arrival times (the "CU KS test") has low power against one of the key alternative hypotheses: that the interarrival times are not exponentially distributed. To address this, we need a more targeted approach.
The assumption that arrivals in a subinterval follow a Poisson process has two distinct, testable components:
- The interarrival times are exponentially distributed.
- The interarrival times are independent and identically distributed (IID).
We therefore need to perform two separate statistical tests on the set of interarrival times within each subinterval.
[PDF] Modeling telemedicine customer arrivals - Diva-portal.org
This master's thesis provides a clear, applied example of the two-test procedure we will adopt. It's an excellent practical guide.
First, read the section "Verifying the Poisson assumption," which frames the problem as verifying two distinct properties. Next, read "Exponentiality of interarrival times." This section describes using the Kolmogorov-Smirnov (KS) test to check for exponentiality. Note the mention of the Lilliefors correction, which is appropriate when the distribution's parameters are estimated from the data itself. Finally, read "Independence of interarrival times." This explains the use of the BDS test to check for independence in the sequence of interarrival times.
3. Application: Diagnosing the Photoshoot Flow
Let's synthesize this into a concrete plan for our boudoir photoshoot scenario. Suppose we have the timestamps from a 90-minute shoot where the photographer marked every "peak photogenic moment."
Step 1: Partition the Data
First, we apply the piecewise-constant approximation. We divide the 90-minute session into six 15-minute subintervals. This choice involves a trade-off.
[PDF] Are Call Center and Hospital Arrivals Well Modeled by ...
Let's revisit the Kim and Whitt paper for their comment on this trade-off.
In the section "Choosing Subintervals with a Nearly Constant Rate," find the authors' direct quote on this balance. Shorter intervals give a better approximation of a constant rate, but leave you with fewer data points per interval and break up potential long-range dependencies.
Step 2: Perform the Tests
For each of the six 15-minute intervals, we extract the list of interarrival times. Then, for each list, we perform our two hypothesis tests (e.g., at a 5% significance level):
- Test 1 (Exponentiality): The null hypothesis is that the interarrival times are exponentially distributed. We use a Lilliefors-corrected KS test. If the p-value is less than 0.05, we reject .
- Test 2 (Independence): The null hypothesis is that the interarrival times are IID. We use a BDS test. If the p-value is less than 0.05, we reject .
Step 3: Analyze the Implications
This is where the results become operationally meaningful. We can categorize each 15-minute subinterval based on the test outcomes.
-
Case A: Both tests pass. The Poisson assumption holds for this interval. We can confidently estimate the rate for this block. By comparing rates across blocks, we can identify the "golden hour" of the photoshoot—the period of highest creative output. Future shoots can be structured to place the most important outfits or poses within this high- window.
-
Case B: Exponentiality test fails, Independence test passes. This is a very common and insightful outcome. It means the process is not Poisson, but it is a more general renewal process. The waiting time for the next peak moment is not memoryless; it depends on the time elapsed since the last one.
- Implication: This points to dynamics like a "warm-up" or "refractory" period after a successful shot. For example, the probability of the next peak moment might be low immediately after the last one, then increase over the next few minutes. This suggests modeling the interarrival times with a Weibull or Gamma distribution, as we alluded to in the last lesson. Operationally, it might mean the photographer should allow for short pauses after a flurry of great shots to let the creative energy "renew."
-
Case C: Independence test fails. This implies that the length of one interarrival time predicts the length of the next. The process is not a renewal process.
- Implication: This could signal momentum or fatigue. For example, a short interarrival time might be followed by another short one (positive autocorrelation), indicating the model is "in the zone." Conversely, a burst of activity (several short interarrival times) might lead to exhaustion, causing a subsequent long interarrival time (negative autocorrelation). This is a more complex process that cannot be modeled by simple renewal theory and may require time-series models that explicitly account for this dependence.
-
Case D: Both tests fail. The process is neither Poisson nor a simple renewal process. The dynamics are complex, with both non-exponential waiting times and dependence between them.
The telemedicine thesis you read provides a perfect example of how these results are categorized.
[PDF] Modeling telemedicine customer arrivals - Diva-portal.org
This table neatly summarizes the possible outcomes of our two-test procedure.
In the section "Poisson properties," examine Table 4.1. It shows the percentage of intervals that were classified as "Poisson" (passed both), "Exponential" (passed only KS), "Independent" (passed only BDS), or "Neither." This is exactly the kind of diagnostic summary we would create for our photoshoot data.
Conclusion
In this lesson, we developed a practical, statistically robust procedure to test whether a sequence of events fits a Nonhomogeneous Poisson Process. By approximating the process as piecewise-constant and applying two targeted tests—the KS test for exponentiality and the BDS test for independence—we can not only validate the model but also gain deep insights from its failures.
Key Takeaways:
- To test if events follow an NHPP, we can partition the time into subintervals and test if each subinterval follows a homogeneous Poisson process.
- The Poisson assumption rests on two pillars: exponential interarrival times and independent interarrival times. These can be tested separately using the KS and BDS tests, respectively.
- If the exponentiality test fails, it suggests a more general renewal process where the hazard rate is not constant.
- If the independence test fails, it suggests a more complex process with memory between events, such as a time-series model.
- The outcome of these tests provides powerful diagnostic information to guide the selection of a more appropriate stochastic model for the process under study.
In our next lesson, we will shift gears from modeling discrete events to modeling continuous phenomena. We will learn how to calibrate a Brownian Motion model to represent the drift and volatility of the hotwife's intimacy satisfaction, and use it to forecast confidence intervals for future satisfaction levels. This will introduce a new set of tools for understanding systems that evolve continuously and randomly over time.