Introduction
In our last lesson, we developed a complete practical framework for calibrating the Geometric Brownian Motion (GBM) model to historical data. We established how to estimate the annualized drift and volatility from a time series of stock prices. This equipped us with a fully specified stochastic model for a stock's price path.
Now, we will put that model to its intended use. This lesson focuses on applying the lognormal model to make quantitative forecasts. Your background in probability theory will be especially valuable here, as the entire process relies on the properties of the normal distribution, which you are very familiar with. Our goal is to calculate the probability of a future stock price crossing a certain threshold and to determine quantiles of the future price distribution, which are essential for applications like risk management.
The Lognormal Property: Our Analytical Engine
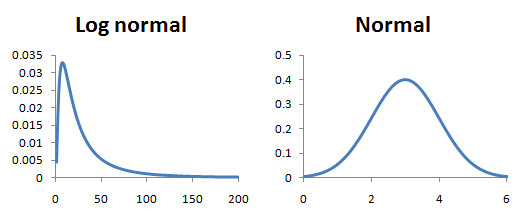
Let's begin by revisiting the cornerstone of our model. We established that if a stock price follows GBM, its future value at time , denoted , is lognormally distributed. More specifically, the natural logarithm of the future price is normally distributed. This is the key that unlocks our ability to perform calculations.
The distribution is given by:
Equivalently, we can express this in terms of the continuously compounded return over the period:
Here, is the current price, is the time horizon in years, and and are the annualized drift and volatility parameters we learned to estimate in the previous lesson.
This relationship means that while the stock price itself has a skewed, lognormal distribution, its logarithm has the familiar, symmetric bell-curve shape of a normal distribution.
Calculating Probabilities of Future Stock Prices
A common question in finance and for your CM2 exam is to find the probability that a stock price will be above or below a certain level at a future date. For example, what is for some strike price ?
Since we know the distribution of , the procedure is a standard application of normal distribution theory:
- Transform the Inequality: Since the natural logarithm is a monotonically increasing function, the inequality is equivalent to .
- Standardize: We convert our normally distributed variable into a standard normal variable using the formula .
Let's define the mean and standard deviation of :
- Mean:
- Variance:
- Standard Deviation:
The probability calculation becomes:
This simplifies to:
The expression on the right is just a number, which we can look up in a standard normal cumulative distribution function (CDF) table, denoted by . Remember that .
The following document provides a clear, step-by-step example of this exact calculation.
7.5 The log-normal model for the stock price Suppose S(t) ...
These notes from the University of Bath provide an excellent set of worked examples for the lognormal model.
Please focus on the section "7.6 Some sample calculations for the lognormal process". Pay close attention to example (ii), calculating P[S(t) >= 70]. Follow how they define the parameters, calculate the mean of the log-return (denoted by c), and then standardize the variable to find the probability using a standard normal distribution. This is a perfect template for exam-style questions.
Let's work through another example, this time using a typical exam problem format.

Let's break down the solution in the image:
- Parameters: , , . The dividend yield is 0 for a non-dividend-paying stock.
- Target: We want to find .
- Distribution: The model states .
- Calculate Mean and Variance:
- Mean = .
- Variance = .
- So, .
- Standardize:
- Solve: Using symmetry of the normal distribution, . Looking this value up in a normal table (or using a calculator's CDF function, ), gives approximately 0.4067, or 40.7%, matching option C.
Calculating Quantiles and Confidence Intervals
The other side of the coin is calculating quantiles, which involves finding a price level corresponding to a given probability. This is fundamental for constructing confidence intervals or calculating risk measures like Value at Risk (VaR).
The procedure is the reverse of the one above:
- Identify the Probability: For a 95% confidence interval, we are interested in the 2.5% and 97.5% quantiles. For a 95% VaR, we are interested in the 5% quantile of the future price.
- Find the Z-score: Find the standard normal quantile that corresponds to your desired probability . For example, for a 95% confidence interval, we need and .
- "Un-standardize" to find :
- Exponentiate: To get the price quantile , we take the exponential of the result.
This formula allows us to directly calculate any quantile of the future price distribution.
The following video provides an excellent walkthrough of calculating both confidence intervals and Value at Risk, which are direct applications of this quantile calculation method.
FRM: Lognormal value at risk (VaR)
The video "FRM: Lognormal value at risk (VaR)" from Bionic Turtle clearly demonstrates these concepts.
First, watch the segment on constructing a confidence interval. The presenter shows how the formula for the lower and upper bounds incorporates the two-tailed normal deviate (1.96 for 95% confidence). This directly matches our formula for S_{T,p}. Next, watch the section on calculating Value at Risk (VaR). Notice this is essentially the same calculation as the lower bound of the confidence interval, but it uses the one-tailed deviate (1.645 for 95% confidence), as VaR is concerned only with downside risk.
As you can see, calculating a probability and calculating a quantile are two sides of the same coin, both anchored in the process of standardizing a normal variable. This is a skill you'll use repeatedly in the CM2 syllabus.
A Powerful Shortcut: The d2 Connection
For calculating probabilities of the form , there's a convenient link to the Black-Scholes option pricing formula, which you will study in detail later. One of its components, , has a useful probabilistic interpretation. The formula is:
In the Black-Scholes world, is the risk-neutral probability of . If we simply replace the risk-free rate with the real-world drift rate , this formula gives us the real-world probability.
Let's define a modified for our purpose:
Then, the probability is simply:
where is the standard normal CDF. This can be a very quick way to solve problems if you are comfortable with the Black-Scholes formulas.
Calculating the Probability of a Stock Being in a Certain Price Range
This video, "Calculating the Probability of a Stock Being in a Certain Price Range," demonstrates this exact shortcut.
Watch the section from using the Black-Scholes model. The presenter shows how to calculate the probability of the stock being in a range [100, 120] by finding P(S_T > 100) - P(S_T > 120). They calculate each of these probabilities using the d2 term from the Black-Scholes model, confirming that it produces the same result as more direct methods.
Conclusion
In this lesson, we have leveraged the lognormal property of stock prices to perform crucial practical calculations. By understanding that the logarithm of a future stock price is normally distributed, you can now confidently tackle exam questions that require you to compute probabilities and quantiles.
Key Takeaways:
- The core of all calculations is the fact that follows a normal distribution: .
- To calculate probabilities like , you transform the inequality by taking logs () and then standardize the normal variable to find the probability using a standard normal table.
- To calculate a price quantile (like for a confidence interval or VaR), you find the corresponding standard normal z-score and "un-standardize" it back into a log-price, then exponentiate to get the final price.
- The general formula for a price quantile is .
With the ability to both estimate the model's parameters and use them to make probabilistic statements, you now have a complete, albeit simplified, toolkit for quantitative asset modeling.
In our next lesson, we will step back and take a critical look at this model. While powerful and elegant, the lognormal model has several important limitations that you must be aware of. We will explore where the model's assumptions fall short of reality and the implications this has for financial modeling.