Welcome to our next session on utility theory. In the previous lesson, we established how to use the Expected Utility Theorem to decide between different risky investments by comparing their expected utility, . This gave us a rule for saying "Investment A is better than Investment B."
Today, we will build directly on that foundation to quantify exactly how much a risky prospect is worth to an investor. This allows us to attach a precise, certain monetary value to a gamble. We will introduce two of the most important concepts in the practical application of utility theory: the certainty equivalent and the risk premium. By the end of this lesson, you will be able to calculate both of these for gambles using the common utility functions you'll encounter on the CM2 exam: power, exponential, and logarithmic.
1. Defining the Certainty Equivalent and Risk Premium
In our last lesson, we saw that for a risk-averse person, the utility they get from the expected value of a gamble is greater than the expected utility of the gamble itself (). This creates a "gap" that reflects their dislike of risk. The certainty equivalent and risk premium are what give this gap a name and a number.
-
The Certainty Equivalent (CE) is the amount of guaranteed money that would give an individual the same level of utility as a particular risky gamble. In other words, it's the risk-free cash amount that an investor would find equally attractive as the gamble. An investor would be indifferent between taking the gamble and receiving the certainty equivalent for sure. It is the answer to the question: "What is this gamble worth to you, in certain dollars?"
-
The Risk Premium (RP) is the difference between the expected monetary value of a gamble and its certainty equivalent. It represents the amount of expected return an investor is willing to sacrifice to avoid the risk of the gamble. It answers the question: "How much are you willing to 'pay' out of the gamble's expected profit to get a sure thing instead?"
The relationship is:
For a risk-averse investor, the risk premium is always positive.
The following diagram provides a perfect visual summary of these concepts.
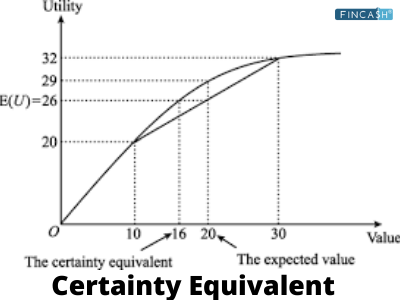
As the graph illustrates, we start with a gamble, find its expected utility , and then find the certain wealth level that gives us that exact same utility. That wealth level is the certainty equivalent.
2. The Calculation Process
The calculation follows a clear, three-step process that builds on what you already know.
- Calculate the Expected Utility of the Gamble: This is exactly what we did in the last lesson. For a gamble with outcomes and probabilities :
- Find the Certainty Equivalent (C): By definition, the utility of the certainty equivalent is equal to the expected utility of the gamble. To find , you simply apply the inverse utility function, , to the expected utility value.
- Calculate the Risk Premium (RP): First, calculate the expected monetary value of the gamble, . Then, use the definition of the risk premium.
Let's watch a video that walks through this entire process with a numerical example using a square root utility function, which is a form of power utility ().
certainity equivalent | risk premium | risk aversion| expected utility | expected value |
The video "certainity equivalent | risk premium" by ECON MATHS provides a full, self-contained example. It's a great demonstration of the core calculation.
Please watch from the beginning up to the main example. The presenter will: Set up a gamble and calculate its expected monetary value (E[W]). Define a utility function (U(x) = \sqrt{x}) and calculate the expected utility of the gamble (E[U(W)]). Use the expected utility to solve for the certainty equivalent (C). Calculate the risk premium (RP) as the difference between the expected value and the certainty equivalent.
3. Examples with Key Utility Functions
Now, let's apply this method to the three key utility functions specified in the learning outcome.
Power Utility:
The video you just watched used a square root utility function. For written reinforcement, the following resource works through another concise, numerical problem. This is a common format for exam questions.
[PDF] Problem set 5 - Johannes Gutenberg-Universität Mainz
This document from a university macroeconomics course contains a problem set on utility theory. We will focus on a specific problem that calculates the certainty equivalent.
Please read the sections titled "Problem 3 (Certainty equivalent and risk aversion)". Focus on the parts labeled "Coefficient of risk aversion", where the utility function is defined, and then the parts labeled "Computing the certainty equivalent" and "Comparing C with µ". This walks through the exact calculation for a 50/50 lottery, finding C=9 and comparing it to E[W]=10.
Logarithmic Utility:
Log utility functions are a cornerstone of financial modeling and represent a risk-averse investor with decreasing absolute risk aversion (meaning they are willing to risk more dollars as they get wealthier).
To solve for the certainty equivalent from the equation , you use the exponential function: .
The following short video provides a very clear and quick numerical example of this calculation.
The video "Certainty Equivalent" from the Economics Lessons channel gives a direct and practical example using log utility.
Watch the full clip from the example. It efficiently calculates the expected wealth, finds the expected utility using a log function, solves for the certainty equivalent, and computes the risk premium.
Exponential Utility:
Exponential utility represents an investor with constant absolute risk aversion (CARA). This means their willingness to take a risk of a certain dollar amount doesn't change with their level of wealth. The parameter determines the degree of risk aversion. (Note: sometimes the form is used; the results for CE and RP are identical).
Let's work through an example together.
An investor has a utility function and faces a gamble with a 50% chance of a final wealth of $50 and a 50% chance of a final wealth of $100.
1. Calculate Expected Utility :
The utilities of the two outcomes are:
The expected utility is:
2. Find the Certainty Equivalent (C):
We set equal to the expected utility:
Now, we solve for C:
The certainty equivalent of this gamble is approximately $62.28.
3. Calculate the Risk Premium (RP):
First, find the expected monetary value of the gamble:
Now, calculate the risk premium:
This investor is willing to give up $12.72 in expected value to avoid the risk of this gamble.
Conclusion
In this lesson, we have translated the abstract concept of risk aversion into concrete, calculable numbers that have real-world meaning for investment decisions. You now have the tools to quantify the value of a risky prospect for a given investor.
Here are the key takeaways:
- The Certainty Equivalent (C) is the risk-free amount that provides the same utility as a gamble. It's found by inverting the expected utility: .
- The Risk Premium (RP) is the compensation an investor demands for bearing risk. It's calculated as the difference between the gamble's expected monetary outcome and its certainty equivalent: .
- For any risk-averse investor (concave utility function), the certainty equivalent will be less than the expected value of the gamble, resulting in a positive risk premium.
- You can now apply this three-step calculation process to gambles involving power, logarithmic, and exponential utility functions.
We have now explored how to model an investor's subjective attitude towards risk. In our next lesson, we will shift focus to objective, statistical measures used to quantify the risk inherent in an asset or portfolio, such as variance, semi-variance, and shortfall probability.