Hello and welcome to your third lesson.
In our previous sessions, we've built a solid foundation. We started by breaking down set pieces into four key phases (Preparation, Delivery, Execution, Transition) and then populated those phases with the specific player roles for both attack and defence. We now have a clear understanding of the 'what', 'when', and 'who' of a set piece.
Today, we move from qualitative description to quantitative measurement. A critical part of a modern coach's job, and a skill you've highlighted as important for your goal, is using data to evaluate performance. Simply counting goals isn't enough; we need to understand the quality of the chances we create and concede.
This lesson will introduce you to the tools for this analysis. We will define key set piece performance indicators (KPIs) and the concept of Expected Goals (xG). This will give you a new language to describe and analyse set-piece effectiveness, moving you from observation to objective analysis.
What are Key Performance Indicators (KPIs)?
In football, a Key Performance Indicator (KPI) is any specific, measurable value that helps you evaluate how well a team or player is performing a certain task. For a set-piece coach, KPIs are your evidence. They help you answer questions like:
- Are our corner deliveries reaching dangerous areas?
- Which of our players is most effective in the air?
- Are we creating high-quality chances from free kicks?
Simple KPIs could be "number of shots from corners" or "percentage of successful deliveries." However, modern analytics offers far more insightful metrics. Let's look at a powerful example that directly relates to the player roles we discussed in the last lesson.
Using Advanced Data To Inform Set Piece Strategy
The article 'Using Advanced Data To Inform Set Piece Strategy' from StatsBomb introduces a KPI called HOPS (Heading Objective Performance Score). This is an excellent example of a specific, advanced metric that a set-piece coach would use.
Please read the introduction and the first two sections of the article, stopping before the 'Case Study'. Focus on what HOPS measures and how a coach could use it for both defensive and offensive planning.
As the article explains, HOPS is a metric that evaluates a player's aerial ability. For you as a set-piece coach, this is invaluable. Instead of just relying on reputation or a small sample of watched games, you get an objective measure of who your best aerial specialists are. You can use HOPS to:
- Assign defensive roles: Decide who should be in your first zonal line to attack the ball or who should man-mark the opponent's biggest aerial threat.
- Plan attacking routines: Identify mismatches where your player with a high HOPS score is being marked by an opponent with a low score, creating a clear target for your delivery.
HOPS is a great example of a KPI, but the most foundational metric in modern football analysis is Expected Goals, or xG.
The Concept of Expected Goals (xG)
Have you ever watched a match where your team had 20 shots but lost 1-0 to a single breakaway goal? The final score doesn't tell the full story of the game. Expected Goals (xG) was developed to solve this problem.
xG measures the quality of a shot, not just the quantity. It assigns a probability value between 0 (impossible to score) and 1 (a certain goal) to every shot, based on historical data from tens of thousands of similar shots.
To get a clear understanding, let's watch a short video.
The video 'What is xG?' from Tifo Football provides a perfect introduction to the concept. It explains what xG is, what factors are considered, and what it's used for.
Watch the video from the beginning until 02:23. Pay close attention to the definition of xG and the three main factors that influence a shot's xG value.
As the video explained, the key factors that determine a shot's xG value are:
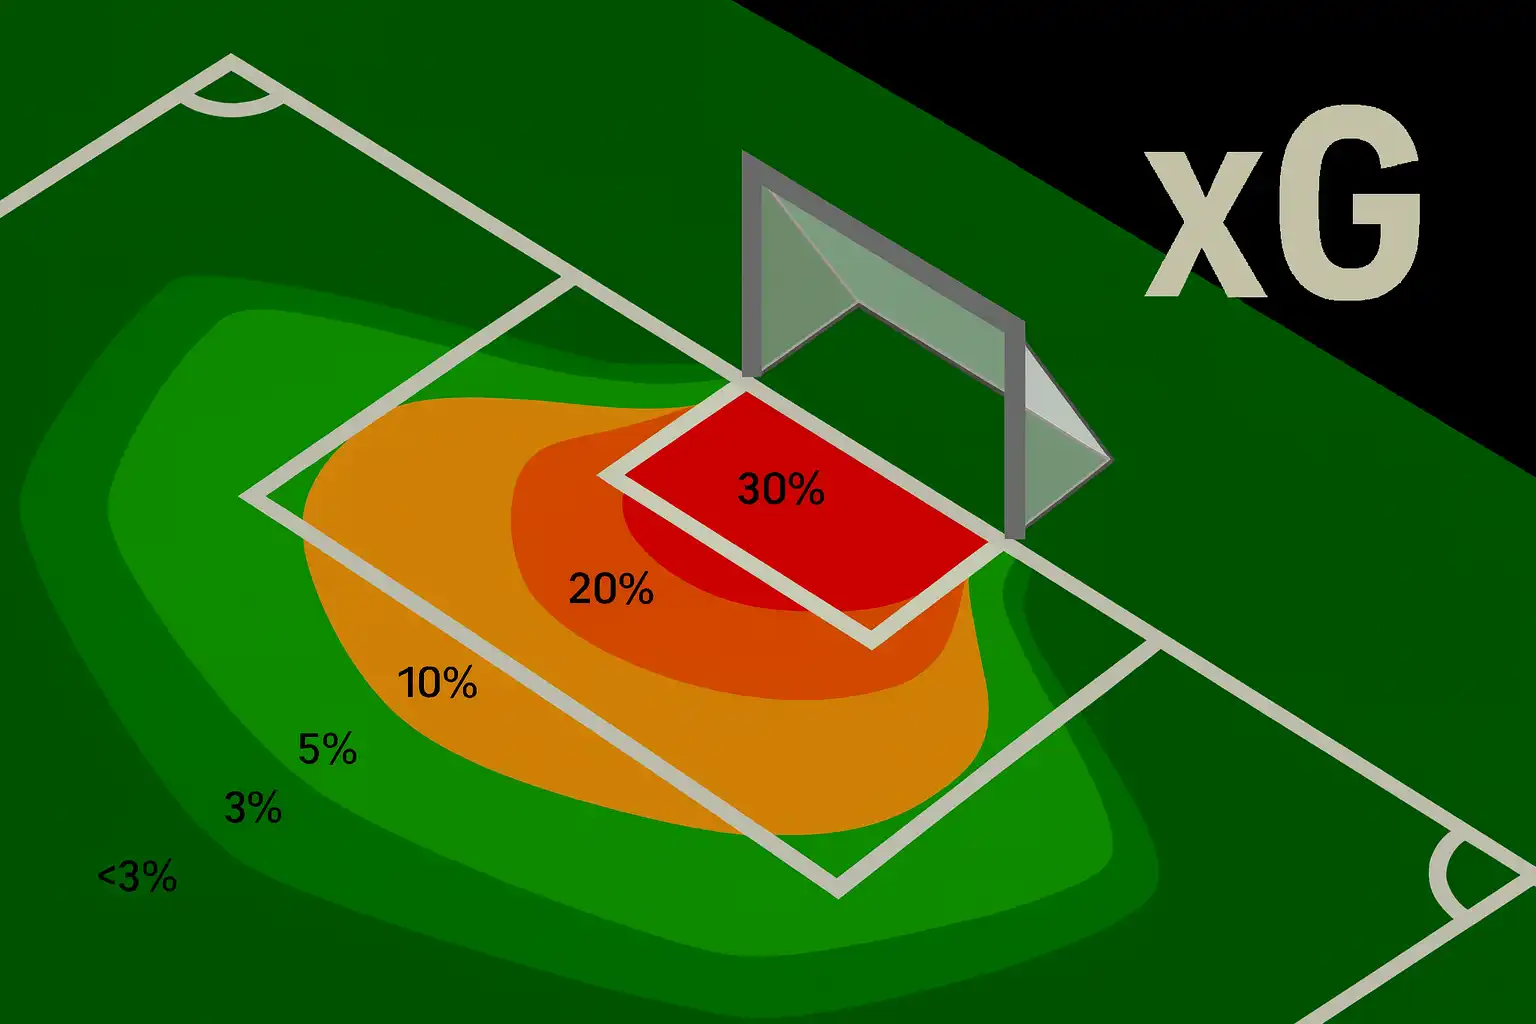
- Distance from goal: A shot from 6 yards out has a much higher xG than one from 30 yards.
- Angle to goal: A shot from a central position is more likely to score (higher xG) than one from a tight angle.
- Type of attempt: A shot with the feet generally has a higher xG than a header from the same position, as headers are harder to control.
More advanced models, like the one mentioned in the video, also consider the position of defenders between the ball and the goal.
This image provides a great visual summary of how xG changes based on shot location.
Test your understanding!
Imagine two scenarios from a corner kick:
- Scenario A: Your centre-back wins a header from the penalty spot (12 yards out).
- Scenario B: The ball is cleared to your midfielder, who shoots from the edge of the box (18 yards out).
Which scenario would likely have a higher xG value, and why?
Show answer
Scenario A would have a higher xG.
Reasoning: Even though it's a header (which typically lowers xG compared to a foot shot from the same spot), the shot is significantly closer to the goal. As we've learned, distance is one of the most important factors in determining xG. The shot from 12 yards is much more likely to result in a goal than the shot from 18 yards.
Applying xG to Set Pieces
So, how does this relate directly to your work? The power of xG is that we can filter it to analyse specific situations. A team's total xG in a match can be broken down into xG from open play and xG from set pieces.
This shot map for Manchester United shows exactly that.

This is a top-level KPI for a set-piece coach. It tells you the total quality of chances your team generated from all set pieces over a period. But we can get even more specific.
The Power of Football Expected Goals
The article 'The Power of Football Expected Goals' by Octosport explains various metrics derived from xG. This is key to understanding the specific KPIs you'll use.
Please read only the section titled 'Beyond xG'. This section lists several specific xG-based metrics. Focus on the ones related to set plays.
From that article, these are the most important KPIs for you to know:
- xG Set Play (xGSP): The total Expected Goals generated from all set-piece situations (corners, free kicks, and penalties).
- xG Corners: The xG generated from corner kicks only.
- xG Free Kick: The xG generated from free kicks only.
- Non-Penalty xG (npxG): A team's total xG minus any penalties. This is useful for comparing how much of a team's threat comes from open play and non-penalty set pieces versus penalties, which are high-xG but infrequent events.
- xG Against (xGA): The total xG your team concedes. This can also be filtered, for example, to see your xGA from Corners, which measures how good your defensive setup is at preventing high-quality chances.
A Final Note: Data Needs Context
It's crucial to remember that xG is a tool for analysis, not a final judgment. A high xG doesn't guarantee a win, and a low xG doesn't always mean a poor performance. As a coach, you must combine data with tactical analysis.
The second Tifo video, "Does xG tell the whole truth?", makes this point brilliantly. It explains that factors like the score at the time of the shot (the "game state") can influence xG totals. For example, a team that is already losing 2-0 might create lots of chances as the opponent sits back, inflating their xG without reflecting their overall effectiveness. We won't watch it now, but keep this in mind: data provides the "what," and video analysis provides the "why."
Conclusion
In this lesson, we have moved into the world of analytics, a cornerstone of modern coaching. You now have the vocabulary to measure and discuss set-piece performance with objectivity.
Key Takeaways:
- Key Performance Indicators (KPIs) are measurable values used to evaluate performance. An example relevant to set pieces is HOPS, which measures aerial ability.
- Expected Goals (xG) is a foundational KPI that measures the quality of a shot, assigning it a probability of being a goal based on factors like distance, angle, and shot type.
- As a set-piece coach, you will focus on specific metrics like xG Set Play (xGSP), xG Corners, and their defensive equivalents (xGA from Set Play) to evaluate your team's effectiveness.
- Data is a powerful tool, but it always requires context from video and tactical analysis to tell the full story.
Preview of the Next Lesson:
Now that you can define these important metrics, our next step is to put them to use. In the following lesson, you will learn how to analyse the impact of set pieces on match outcomes using goal contribution and xG data. We will begin to bridge the gap between theory and practical application, analysing real match scenarios to see how data can reveal a team's set-piece strategy.