Hello! Welcome to your next lesson in our journey through the foundations of linear algebra.
In our last session, we explored the idea of a function as a rule that takes an input and produces a single, predictable output. We represented these as input-output pairs. Today, we will learn how to give these abstract pairs a visual home, moving from pure algebra to the world of geometry. Our goal is to master the skill of plotting points on a two-dimensional Cartesian coordinate plane. This is the first and most crucial step in learning to "see" mathematical relationships, a skill that will be indispensable as we begin to visualize vectors and transformations later in the course.
The Coordinate Plane: A Map for Numbers
Imagine trying to describe a location in a city. You might say, "Go three blocks east and two blocks north." This gives a precise address relative to a starting point. The Cartesian coordinate plane does the exact same thing, but for numbers. It provides a visual grid where every pair of numbers has a unique address.
This system is the bridge between algebra (like the function ) and geometry (the line we can draw to represent it). Let's see how this "map" is constructed.
Algebra Basics: Graphing On The Coordinate Plane - Math Antics
This video from Math Antics provides an excellent, intuitive introduction to the coordinate plane, showing how it's built from two simple number lines.
Please watch the video from the beginning until the end of the explanation of ordered pairs. Pay close attention to how two 1D number lines are combined to create a 2D plane and how the (x, y) format, called an ordered pair, works.
As the video explained, the coordinate plane is built from two perpendicular number lines:
- The horizontal line is the x-axis.
- The vertical line is the y-axis.
- They intersect at a central point called the origin, which has the address (0, 0).
Any point on this plane can be described by an ordered pair of numbers, (x, y). This is the direct link to our last lesson! The x value is the input, and the y value is the output.
To solidify this idea, let's explore a helpful analogy.
This reading uses a city grid analogy, which is a fantastic way to build intuition for how coordinates work as an "address."
Please read the entire first section, from the beginning down to the image titled Carl's Neighborhood. This will reinforce the concepts of positive/negative directions and the (horizontal, vertical) ordering.
Plotting Points: From Address to Location
Now that we understand the "address" system, how do we find a location on the map? This process is called plotting a point. Given an ordered pair like (6, 2), our task is to find its exact spot on the plane.
There's a simple, reliable method:
- Start at the Origin (0, 0). Always.
- Move along the x-axis. The first number (the x-coordinate) tells you how far to move horizontally. Positive means move right; negative means move left.
- Move along the y-axis. From your new position, the second number (the y-coordinate) tells you how far to move vertically. Positive means move up; negative means move down.
- Mark the spot. This final location is your point.

Let's see this method in action with both positive and negative coordinates.
Algebra Basics: Graphing On The Coordinate Plane - Math Antics
We'll return to the Math Antics video to see a clear demonstration of this "move from the origin" method for plotting points.
Please watch the segment from the more intuitive way to plot points. Notice how the signs (positive or negative) of the x and y coordinates dictate the direction of movement (right/left and up/down).
Quadrants and Axes
As you've seen, the x and y axes divide the plane into four regions. These are called quadrants, and they are numbered with Roman numerals, starting from the top right and moving counter-clockwise.
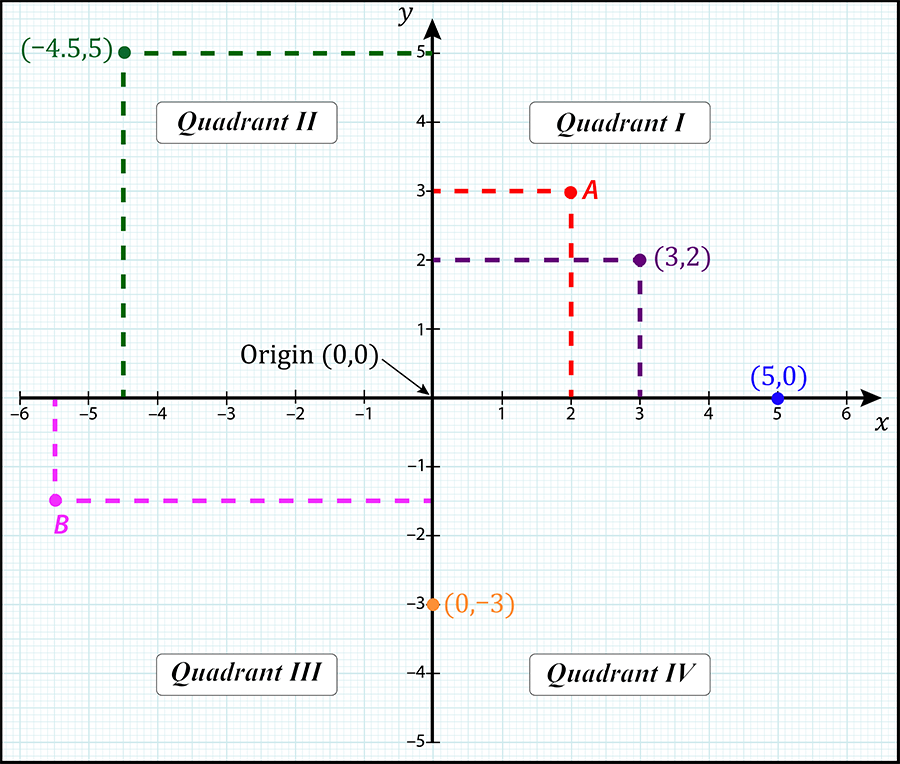
- Quadrant I: Top right, where both x and y are positive
(+, +). - Quadrant II: Top left, where x is negative and y is positive
(-, +). - Quadrant III: Bottom left, where both x and y are negative
(-, -). - Quadrant IV: Bottom right, where x is positive and y is negative
(+, -).
What about points that aren't in a quadrant? If one of the coordinates is zero, the point lies directly on an axis.
- Points like
(5, 0)lie on the x-axis. - Points like
(0, -3)lie on the y-axis.
The Importance of Order
It's called an "ordered pair" for a reason: the order matters immensely. The point (2, 3) is not the same as the point (3, 2).
- For (2, 3), you go right 2, then up 3.
- For (3, 2), you go right 3, then up 2.
Let's quickly read a warning about this common mistake.
Introduction to Cartesian Coordinate Systems | SkillsYouNeed
This short section from SkillsYouNeed emphasizes why the sequence of coordinates is so important.
Read the section titled Warning! Sequence is significant!. This is a small but critical detail to master.
Conclusion
Today we've built a fundamental bridge between algebra and geometry. We've established a visual "map" where we can place the input-output pairs we discussed in our last lesson. This allows us to start seeing the shape and structure of mathematical relationships.
Let's summarize our key takeaways:
- The Cartesian coordinate plane is a 2D grid formed by a horizontal x-axis and a vertical y-axis, which meet at the origin (0, 0).
- Any point on the plane is located by an ordered pair (x, y).
- To plot a point, you start at the origin, move left or right according to the x-coordinate, and then move up or down according to the y-coordinate.
- The order of the coordinates is crucial:
(x, y)is not the same as(y, x).
Now that we know how to plot individual points, what happens if we plot all the points for a function like ? We would see that they don't just appear randomly; they form a straight line. In our next lesson, we'll explore exactly how to do this by graphing a linear equation, connecting the concepts of slope and intercept to the visual line on the coordinate plane.