Hello! In our previous lesson, we developed the skill of taking a linear equation in the form and translating it into a visual graph. You learned how to use the y-intercept (b) as a starting point and the slope (m) as a set of directions to draw a unique line.
Today, we're going to reverse that process. We will look at a finished graph of a line and learn to read the story it tells. The goal isn't just to find the numbers for m and b, but to interpret what they mean. This shift from "how to draw" to "what does it represent" is a crucial step toward the conceptual understanding you're aiming for, as it's how we model real-world relationships, a fundamental idea in AI.
Reframing the Equation for Intuition
The standard form is mathematically efficient, but it doesn't always spark intuition. A more natural way to think about it, especially when interpreting a graph, is to rearrange the terms slightly:
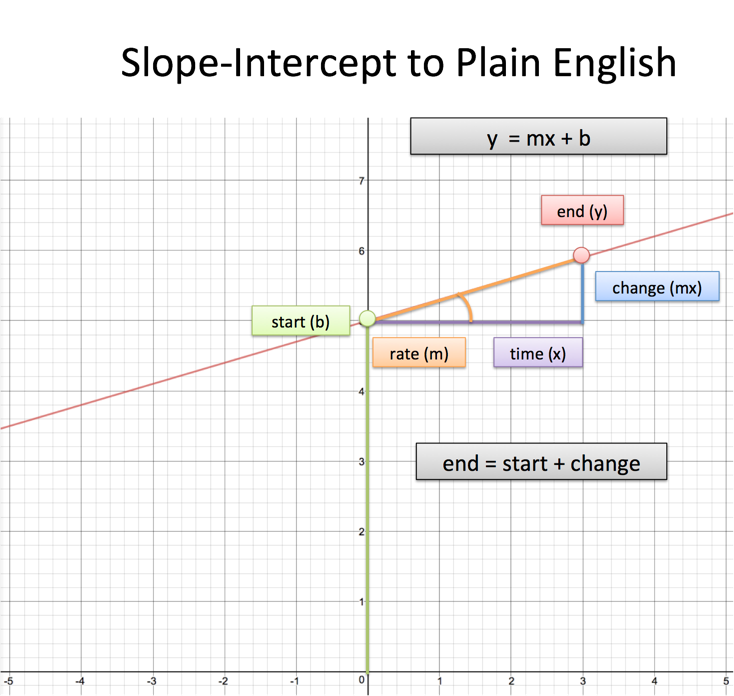
End = Start + (Rate of Change × Time)
This simple sentence is the conceptual key to our lesson. Let's break it down:
yis theEndvalue: Your final position or result.bis theStartvalue: Where you began before any change occurred.mis theRate of Change: How quickly things are changing.xis theTimeor duration: How long the change is applied.
This framework is explored beautifully in an article from BetterExplained.
Intuition for Slope-Intercept Form
This article does an excellent job of translating the abstract y = mx + b into a plain-English, intuitive concept. It will help you build a strong mental model for what a line represents.
Please read the beginning of the article, from the top down to the end of the sentence about intuitive wording. As you read, focus on how the author rephrases the equation and connects it to a real-world process of starting somewhere and making a change.
The image from the article provides a fantastic visual summary of this idea.
Reading the Story on a Graph
With this start + change model in mind, a line on a graph becomes a visual narrative. The y-intercept (b) is the story's beginning, and the slope (m) is the plot, describing how the story unfolds.
The Y-Intercept (b): The Starting Point
The y-intercept is the point where the line crosses the vertical y-axis. At this point, the x-value is always zero. In our new framework, this is the Start value—the value of y before x has had any effect.
Consider these scenarios:
- Finance: If a graph shows your savings over time, the y-intercept is the initial amount you deposited.
- Physics: If a graph shows a car's distance from home, the y-intercept could be its starting distance before it began moving.
- Business: If a graph shows the profit from selling an item, a negative y-intercept would represent the initial setup cost (a debt) before any sales were made.
The Slope (m): The Rate of Change
The slope tells us how the y value changes for every one-unit increase in the x value. It's the Rate of Change.
-
Sign of the slope (Direction):
- Positive slope (
m > 0): The line goes up from left to right. This represents growth or increase. (e.g., your savings growing, the distance from home increasing). - Negative slope (
m < 0): The line goes down from left to right. This represents decay or decrease. (e.g., a phone's battery life draining, the value of a car depreciating). - Zero slope (
m = 0): The line is horizontal. This represents no change. (e.g., the cost of a flat-rate subscription over time).
- Positive slope (
-
Magnitude of the slope (Steepness):
- A steeper line (larger absolute value of
m) means a faster rate of change. (e.g., a more expensive taxi per mile, a faster-draining battery). - A shallower line (smaller absolute value of
m) means a slower rate of change.
- A steeper line (larger absolute value of
Case Studies: Interpreting Different Lines
Let's watch a few examples to see how to apply this interpretive lens. The following video clips show how to graph different lines. We'll use them in reverse: we'll look at the final graph and practice reading its story.
Slope-Intercept Form (y=mx+b) | Graphing and Writing Equations
This video from Math with Mr. J provides four clear examples of lines with different characteristics. We will analyze each one to practice our interpretation skills.
For each segment below, try to first pause on the final graph and answer these questions for yourself: Where does the story start? (What is the y-intercept, b?) How does the story unfold? Is it increasing or decreasing, and at what rate? (What is the slope, m?) What could this line represent in the real world? Then, watch the explanation to confirm your analysis. Case 1: A story of growth from a positive start. Watch from this example of the line y = 2x + 3. The story starts at y=3 and increases by 2 units for every 1 unit x moves to the right. Case 2: A story of climbing out of a deficit. Watch from this example of the line y = \frac{1}{4}x - 6. Here, the story starts at a deficit (y=-6) and slowly increases. Case 3: A story of decline from a high point. Watch from this example of the line y = -3x + 5. This story starts at y=5 and decreases rapidly. Case 4: A story of increasing deficit. Watch from this final example of the line y = -\frac{5}{4}x - 1. This story starts in the negative (y=-1) and goes further down.
To solidify these ideas, the following reading provides more examples connecting equations to their graphical interpretations.
Introduction to Slope-Intercept Form - KATE'S MATH LESSONS
This guide from Kate's Math Lessons offers more examples of identifying the slope and y-intercept from an equation and relating them to a graph.
Please read the sections on slope-intercept form and the following examples. This will reinforce the connection between the components of the equation and the visual characteristics of the line.
Conclusion
Today, you've moved beyond the mechanics of graphing and into the art of interpretation. By viewing a line not as a static drawing but as a dynamic story, you've unlocked a deeper, more intuitive understanding of linear relationships. This skill is foundational for seeing the patterns in data that drive so many applications in machine learning.
Here are the key takeaways:
- A line on a graph tells a story that can be understood with the framework: End = Start + (Rate × Time).
- The y-intercept (
b) is the starting value of the story, wherex=0. - The slope (
m) is the rate of change, or the plot of the story. Its sign indicates direction (increase/decrease) and its steepness indicates speed. - By identifying
bandmon a graph, you can deduce the underlying linear equation and interpret the real-world process it might be modeling.
In our next lesson, we will explore what happens when two of these linear stories are plotted on the same graph. This will introduce us to the concept of systems of linear equations, where we look for points where the stories intersect—a central theme in linear algebra.