Welcome to the first lesson of our final module, "Clinical Synthesis and Application." Throughout this course, you have diligently worked through interpreting individual laboratory panels, from the Complete Blood Count to Thyroid and Lipid panels. In our last lesson, you took a significant step toward synthesis by learning how an abnormal lipid panel can be a clue to an underlying systemic disease.
Today, we take the ultimate step. This lesson is about moving from interpreting siloed reports to practicing like a clinician. When a patient presents with vague symptoms like fatigue, pain, or weakness, you won't get a neat label; you'll get a collection of data from their history, physical exam, and multiple lab panels. Your task is to weave these threads together.
Our goal for this lesson is to develop a differential diagnosis by synthesizing lab results from multiple panels in an undifferentiated patient. We will focus on a systematic approach that grounds your interpretation in the clinical context, helps you identify the most critical abnormalities, and enables you to see the patterns that connect different organ systems.
1. The Art of Clinical Synthesis: A Framework
Interpreting labs for an undifferentiated patient is not a random search for abnormal values. It's a detective story where you use the patient's chief complaint and exam findings as your starting point. These clues help you decide which lab results are the most important and how they might be connected.
The image below shows a simple but powerful framework. The process starts with the patient's history and exam, which generates an initial list of possible diagnoses (a differential). Laboratory tests are then used to narrow down this list, pointing toward the most likely cause.
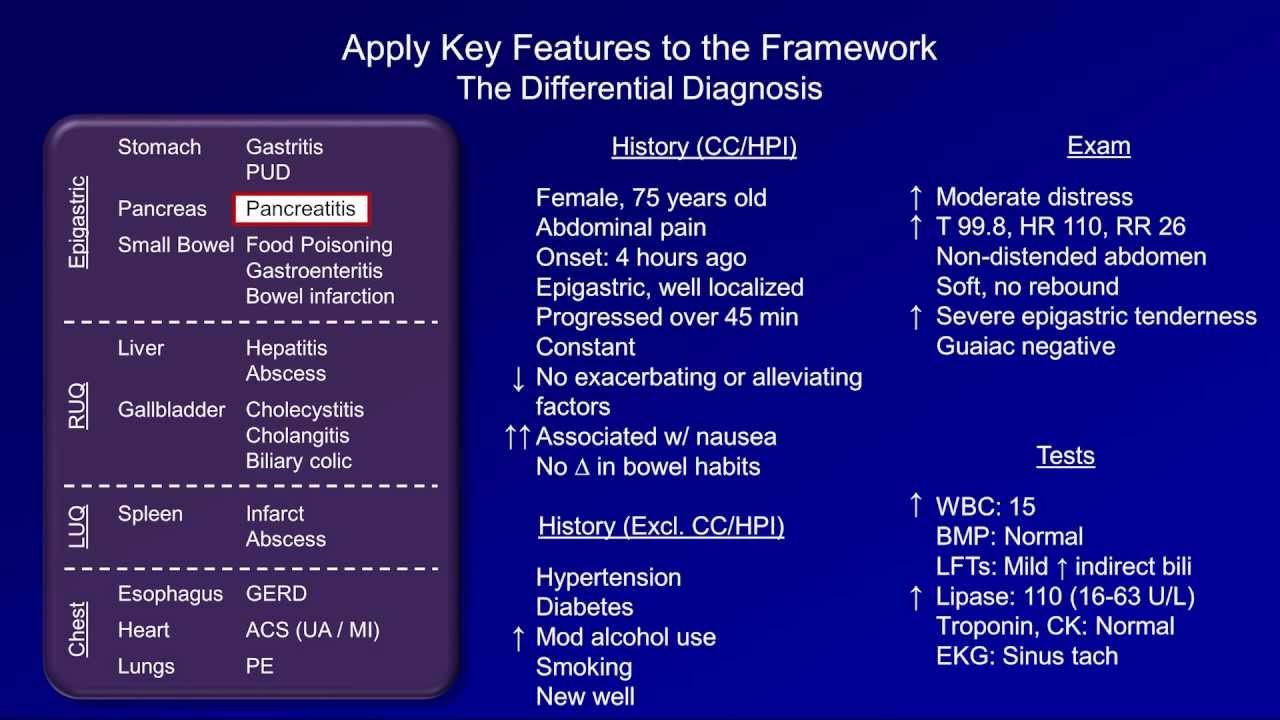
The key steps in this process are:
- Anchor in the Clinical Context: What is the patient's chief complaint and primary problem?
- Scan for Critical Values: Quickly identify any life-threatening abnormalities (e.g., severe hyperkalemia, critical anemia, markedly elevated troponin).
- Identify the "Center of Gravity": Which lab panel or value is most abnormal? This often points to the primary organ system involved.
- Correlate Across Panels: How do abnormalities in one area explain or relate to findings in another? This is the essence of synthesis.
Let's put this framework into practice with our first case.
2. Case Study 1: The Patient with Abdominal Pain
A common and challenging presentation in the emergency department is undifferentiated abdominal pain. The potential causes are vast, spanning multiple organ systems. Let's watch a clinical case simulation to see how a systematic approach works.
Clinical case simulation - 1 | What is your diagnosis and management plan?
This video from Medix Medicine presents a classic case of an undifferentiated patient. We will work through it together in three steps.
First, watch the initial part of the video presenting the patient's history and physical exam (0:07 - 02:30). As you watch, formulate your own initial differential diagnosis for epigastric pain radiating to the back. What are the 'can't miss' diagnoses?
Based on the presentation (severe epigastric pain radiating to the back, nausea, vomiting, icterus), your differential should include:
- Acute Pancreatitis: Classic radiation to the back.
- Cholecystitis/Cholangitis: Right upper quadrant tenderness and icterus are suggestive.
- Peptic Ulcer Disease (especially perforated): Severe epigastric pain.
- Acute Coronary Syndrome (ACS): An inferior MI can present as epigastric pain.
- Aortic Dissection: Can present with severe, tearing abdominal/back pain.
Now, let's see which labs the video suggests ordering and why.
Clinical case simulation - 1 | What is your diagnosis and management plan?
The next segment discusses the initial lab workup based on the differential diagnosis.
Watch the clip from 02:30 to 03:39. Notice how the lab selection is targeted to quickly evaluate the most likely and most dangerous possibilities (pancreatitis, biliary obstruction).
Finally, we get the results. This is where you'll synthesize the data.
Clinical case simulation - 1 | What is your diagnosis and management plan?
Now for the moment of truth. The lab results are in. Let's see how they help us solve the case.
Watch from 03:39 to 05:17. Pay close attention to how the triad of clinical presentation (epigastric pain), specific enzyme elevation (lipase/amylase), and LFT pattern helps to definitively diagnose acute pancreatitis and even suggest its cause.
Case 1 Synthesis:
- Clinical Anchor: Epigastric pain radiating to the back with jaundice.
- Center of Gravity: The pancreatic enzymes. Amylase and lipase are massively elevated (>3 times the upper limit of normal), which is one of the diagnostic criteria for acute pancreatitis.
- Cross-Panel Correlation:
- The liver function tests (LFTs) show a cholestatic pattern: elevated total bilirubin and alkaline phosphatase.
- Synthesizing these two findings (pancreatitis + cholestasis) strongly suggests the cause of the pancreatitis is a gallstone obstructing the common bile duct (gallstone pancreatitis).
- The complete blood count (CBC) shows a high-normal leukocyte count, which is a non-specific sign of inflammation but consistent with the diagnosis.
This case is a perfect example of how combining results from the basic metabolic panel (BMP), LFTs, and specific enzymes (lipase) can not only yield a diagnosis but also point to the underlying etiology.
3. Case Study 2: The Patient with Jaundice and Acute Illness
Now for a more complex case involving multiple organ systems. Here, the lab patterns are more subtle but, when synthesized, are key to unlocking a life-threatening diagnosis. This case is adapted from the New England Journal of Medicine.
Presentation:
An 18-year-old woman, 11 weeks postpartum, presents with a 1-week history of a viral-like illness followed by rapidly developing jaundice, nausea, vomiting, and fatigue. On exam, she is jaundiced and has epigastric tenderness.
Initial Laboratory Results:
For the following labs, you can use the standard reference ranges provided in this USMLE document.
This document contains a standard table of laboratory reference values used for medical board exams. It's a useful resource to have on hand for this course and your studies.
Review the 'Laboratory Values' tables on pages 5-7. You don't need to memorize them, but familiarize yourself with the layout. We will refer to these ranges to interpret our cases.
Here are the patient's key labs:
- Hemoglobin: 7.9 g/dL (Anemia)
- Platelets: 175,000/mm3 (Normal)
- Prothrombin Time / INR: 2.1 (Elevated - impaired synthetic function)
- Total Bilirubin: 26.3 mg/dL (Markedly elevated)
- Direct Bilirubin: 21.9 mg/dL (Primarily conjugated hyperbilirubinemia)
- AST: 152 U/L (Moderately elevated)
- ALT: 24 U/L (Essentially normal)
- Alkaline Phosphatase (Alk Phos): 14 U/L (LOW)
This constellation of findings is diagnostic of Acute Liver Failure (ALF). The flowchart below shows the many possible causes. Our job is to use the specific lab pattern to figure out which one it is.

Test your understanding!
Looking at the lab results, what is the most striking and unusual pattern, especially considering the patient has severe liver failure and jaundice?
Show answer
The most striking pattern is the combination of extremely high bilirubin with a disproportionately low alkaline phosphatase level. In most cholestatic liver diseases that cause such high bilirubin, the Alk Phos would be significantly elevated. Here, it is low. Additionally, the AST is much higher than the ALT, which is another important clue.
This unique pattern is a powerful clue. Let's see how an expert clinician synthesizes this information.
This case from the NEJM's 'Cases in Primary Care' series features an expert discussion on the differential diagnosis of acute liver failure. It's a masterclass in using lab patterns.
Please read the section 'Differential Diagnosis' by Dr. Kristian R. Olson (starts on page 18). Pay special attention to the final section where he discusses Wilson's Disease. Note how he uses ratios of different lab values (Alk Phos to Bilirubin, AST to ALT) to arrive at the diagnosis with high confidence.
Case 2 Synthesis:
- Clinical Anchor: Young woman with acute liver failure.
- Center of Gravity: The liver function tests are clearly the most deranged.
- Cross-Panel Correlation:
- LFTs: The pattern of extremely high bilirubin, low Alk Phos, and an AST:ALT ratio > 2.2 is highly specific for Wilson's Disease presenting as acute liver failure.
- CBC: The presence of anemia suggests a hemolytic process, which is also a feature of acute Wilsonian crisis. The copper released from dying liver cells is toxic to red blood cells.
- Coagulation: The elevated INR of 2.1 confirms severe hepatic synthetic dysfunction, meeting the criteria for acute liver failure.
By synthesizing the specific pattern across LFTs, the CBC, and coagulation studies, the clinician could bypass a long and expensive workup and quickly identify a rare but critical diagnosis that requires immediate evaluation for liver transplantation.
4. A Systematic Approach to Anemia
Our final case demonstrates how a systematic approach, driven by a single abnormal finding on a CBC, can trigger a cascade of investigations across multiple lab panels. The Ninja Nerd video on anemia, while long, provides an excellent algorithmic framework that exemplifies clinical synthesis.
Imagine a patient presents with fatigue. The initial CBC shows: Hemoglobin 7.3 g/dL. This is the anchor. The first step is to determine if this is a production problem or a destruction/loss problem.
Let's review the fundamental branch point in any anemia workup. This clip from Ninja Nerd explains how the reticulocyte count separates anemias into two major categories.
Watch the overview from 01:17 to 10:17. Focus on the core concept: a low reticulocyte index points to an underproduction problem (the 'factory' is broken), while a high index points to loss or destruction (the 'factory' is working overtime to compensate).
Now, let's apply this to a case.
Presentation:
A 75-year-old male, status post-chemotherapy for lung cancer, presents with profound fatigue.
Initial Laboratory Results:
- Hemoglobin: 7.3 g/dL
- Reticulocyte Index: 0.2% (Very low -> Underproduction Problem)
- MCV: 90 fL (Normocytic)
- WBC: 2,100/mm3 (Leukopenia)
- Platelets: 45,000/mm3 (Thrombocytopenia)
The finding of pancytopenia (low RBCs, WBCs, and platelets) immediately tells you the problem is central—in the bone marrow. But what is causing the marrow to fail? A good clinician synthesizes further labs to rule out other causes before concluding it's a primary marrow issue.
The workup for normocytic anemia is a great example of synthesis. Before jumping to a bone marrow biopsy, you must rule out other systemic causes. This next clip walks through that process.
Watch the section on Normocytic Anemias from 26:48 to 37:15. Notice the checklist approach: check iron studies, B12/folate, thyroid, liver, and kidney function. Only after these are normal and there are red flags (like pancytopenia or a very low retic count) do you proceed to a bone marrow biopsy.
This systematic approach is demonstrated in a case study from the same video.
Let's watch the presenter apply this exact algorithm to a case of pancytopenia.
Watch 'Case study 8' from 56:15 to 58:14. See how, after finding a normocytic anemia with pancytopenia and a very low retic count, the next step is to check other panels (iron, folate/B12, CMP) to rule out nutritional or organ-failure causes before concluding the diagnosis is Aplastic Anemia, likely from his chemotherapy.
Case 3 Synthesis:
- Clinical Anchor: Fatigue in a patient with a history of chemotherapy.
- Center of Gravity: The CBC showing pancytopenia.
- Cross-Panel Correlation:
- Reticulocyte count is profoundly low, confirming bone marrow failure.
- MCV is normal, making common nutritional deficiencies less likely (though early stages can be normocytic).
- Synthesizing this with a normal BMP (ruling out kidney failure), normal LFTs (ruling out liver failure), and normal nutritional studies (iron, B12, folate) allows you to confidently diagnose an intrinsic bone marrow problem—in this case, aplastic anemia secondary to chemotherapy.
Conclusion
Today you have moved from being a lab test interpreter to a clinical detective. You've learned that individual lab results are just letters; synthesizing them into patterns is how you read the story of the patient's illness.
Key Takeaways:
- Always start with the clinical picture: Use the patient's history and exam to build an initial differential diagnosis.
- Adopt a systematic approach: Identify the most critical lab abnormalities first, then look for the "center of gravity" that points to the primary problem.
- The power is in the pattern: Synthesize results across the CBC, BMP, LFTs, and other panels. The relationships between abnormal values are often more informative than any single result.
- Differential diagnosis is iterative: Initial labs narrow the possibilities and guide you toward more definitive tests, as seen in the workup for pancreatitis, liver failure, and pancytopenia.
Preview of the Next Lesson:
You have now learned the general skill of synthesizing labs for an undifferentiated patient. In our next lesson, we will apply this skill to specific, high-yield clinical scenarios. You will learn to recognize the classic laboratory "fingerprints" of common syndromes like sepsis, acute kidney injury, and decompensated liver failure, allowing for rapid diagnosis and management in critical situations.